Right now, I’m not stepping in front of this runaway train. There’s a lot of risk on both sides of the street, and traders can easily get torn apart.
Instead, I’m keeping my positions small and using the tools I teach in my Masterclass to select the right option contracts and trades.
Now, you’re probably wondering when and how this will all end. I get that question a lot these days. That’s when I bring up leading indicators.
I’m talking about the VIX, VVIX, treasury bonds, and capitulation patterns.
Leading indicators tell you ahead of time when to expect turns in the market. Instead of telling you what happened, they tell you what should happen.
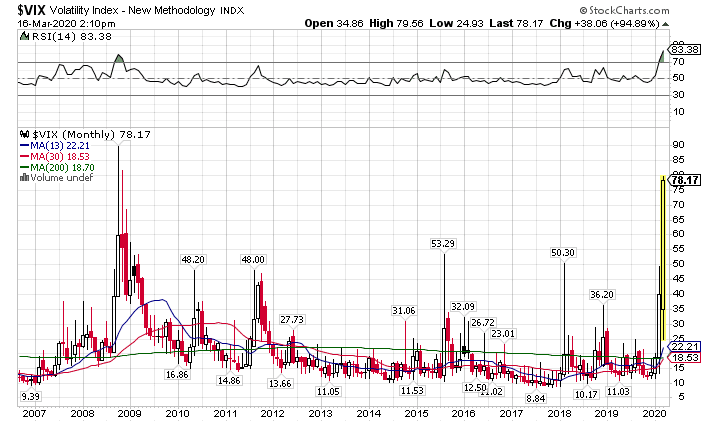
For example, I rely heavily on the VIX and VVIX to tell me when this market will shift. You can see how we’re at levels we haven’t seen since the last recession.

VIX Monthly Chart
Let me walk through each of the indicators I listed and explain why and how I use them.
Understanding the VIX & VVIX
Most of you probably know about options trading. If not, I suggest you check out my free masterclass, where I go over the basics.
Traders and investors use options to hedge their portfolios or make outright speculation bets on the market. As the demand for options grows, so do the price of these options. Demand is measured by implied volatility. Implied volatility for the S&P 500 is measured by the VIX.
In most cases, The VIX and stocks trade in opposite directions. That’s why we’re seeing it at extreme levels with the fall in the S&P 500. This says that traders and investors want to own protection against the downside.
Similarly, the VVIX measures option demand on the VIX. When option demand on the VIX climbs, it means investors want to own protection against rising volatility (which tends to mean lower stock prices).
Here’s the tip I’ve learned over the years. The VVIX often precedes the decline in the VIX. It may not be more than a day or a few hours. However, it’s the best tipoff for a short-term rally that I know of, so keep an eye on this one.
The Treasury Safety Play
U.S. Treasuries and stocks often trade in opposite directions (though not as often as the VIX and stocks). Investors hide money in government bonds, which they view as low-risk assets. Even with the Fed planning to drive up their prices, you still see tons of money pouring in.
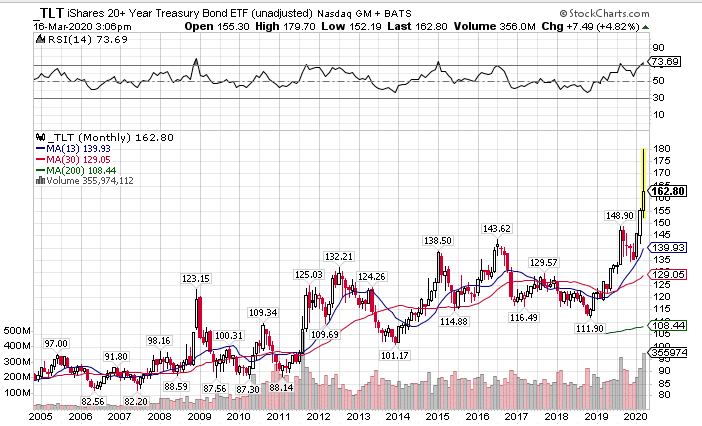
Check out the historic rise in the TLT ETF compared to its entire history.

TLT Monthly Chart
When I see treasuries move up at an unsustainable rate, I would expect to see a bottom in stocks. However, that just hasn’t happened yet. Until I see money start moving out of treasuries, I’m not ready to say the coast is clear.
Capitulation Pattern
No one pattern that tells you when markets have made a bottom. However, there are a few key features to look out for.
- Extremely high volume (I’m talking multiples of average daily size)
- Reversal candlestick patterns over one or two days
- Price slams into a critical support level
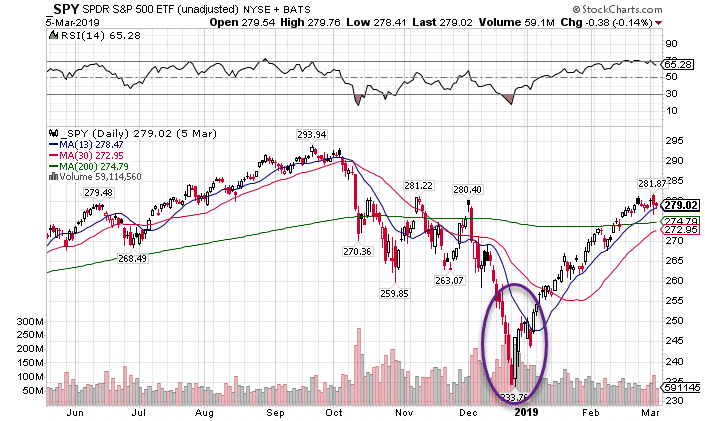
A good example came in back at the end of 2018. Markets saw a crazy selloff after the Fed raised rates that December. Towards the end of the month, stocks found support and ricocheted higher.

SPY Daily Chart
When you look at the actual bottom, you’ll notice all of the key elements I listed above present. There was enormous volume that purged the market. You then see a bullish engulfing candle the following day on huge volume.
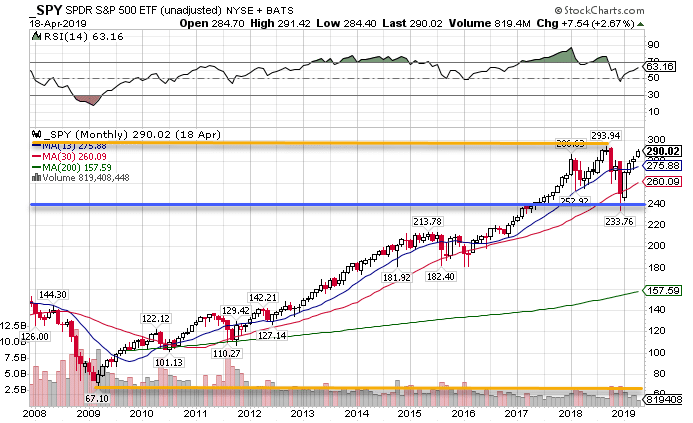
Now, the important level comes from Fibonacci Retracements. When you take the low from 2009 in the SPY of $67.10, the recent high at the time of $293.94, and make a 23.6% retracement, you land at $240.41.
The low of that 2018 move was $233.76.

SPY Monthly Chart
One Other Leading Indicator
Our current market is tied to the Coronavirus outbreak and its impact on the economy. Stocks can’t rally without some clarity as to when this will pass.
As such, I’m looking for when the number of new cases peaks and then starts to decline. That will be the tell for when we can finally look up from this pandemic.
You Aren’t Alone In This
I took a beating from this market drop. Yes, a few people did quite well. But the majority of us got walloped.
Look, I’m right there alongside you, slugging it out. I’ve tightened up my risk controls and pulled back my cash. Now isn’t the time to be a hero.
Rather than stare at your 401k all day, why not prepare yourself for the turnaround? Get the tools to help you succeed with my free option trading masterclass.
