It’s official ladies and gentlemen. We are in a national state of emergency. Schools are closed, the workforce is going remote, sports seasons are being canceled.
There is no sphere of society that hasn’t been impacted by this pandemic.
And for some, that means panicking and pulling their money out of the markets. But for me, I am going in a different direction.
My Total Alpha members who have been watching my portfolio have seen exactly why that is…
Today I want to share one specific trading strategy that I have been using that fits perfectly with this market.
In fact, I used this very same strategy last week to pull a healthy profit out of this volatile market on AAPL.
Now, let’s go through the trade components so you can see how all the pieces of the puzzle fit together because guess what…I’ve got another one this week as well, so hold me accountable and see how I did!
Strangle Basics
A strangle is a fairly simple trade. It involves the selling of both a put and call on the same option for the same expiration. For this trade, I executed the following:
- Sold AAPL $320 call expiring one week out
- Sold AAPL $270 put expiring one week out.
This paid me a credit of $1.00 against the 50 contracts I sold. My maximum profit is the credit I received upfront for this trade. That means my profit potential was:
Maximum Profit Potential = $1.00 x 50 contracts x 100 shares per contract = $5,000
My goal is to have Apple land between these strike prices by the end of the following week. Here’s a look at how the trade brackets out.
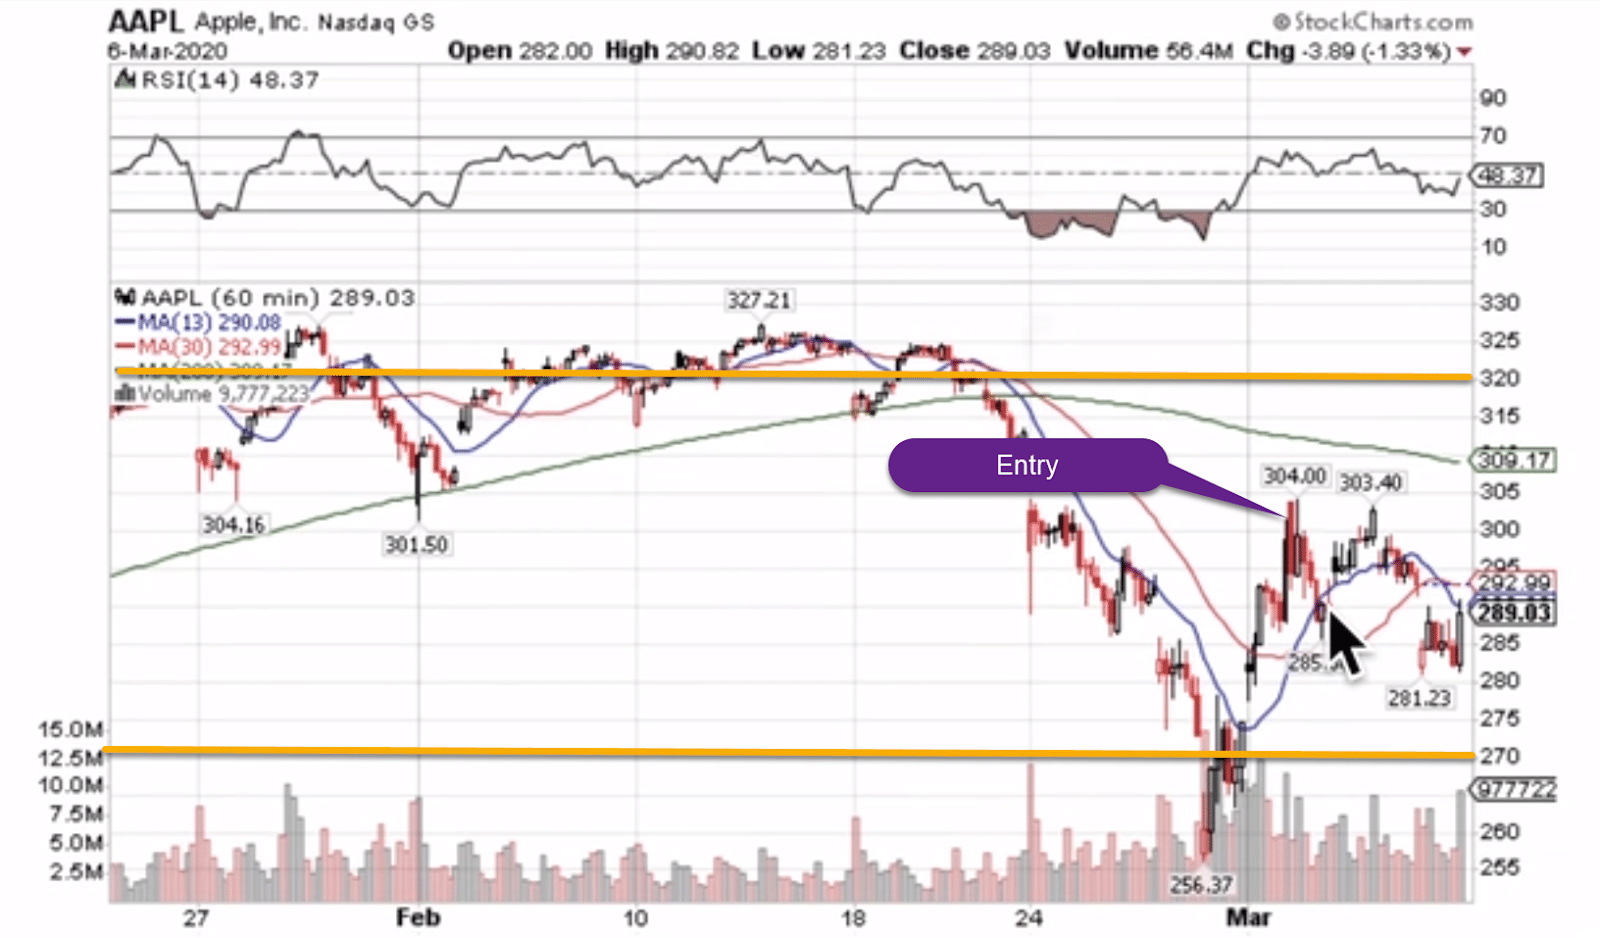
AAPL Hourly Chart
Now, I want to talk about the risks. With undefined risk trades, you could potentially lose infinity to the upside and all the way down to zero on the put side. For a strangle, the payoff diagram looks like this:
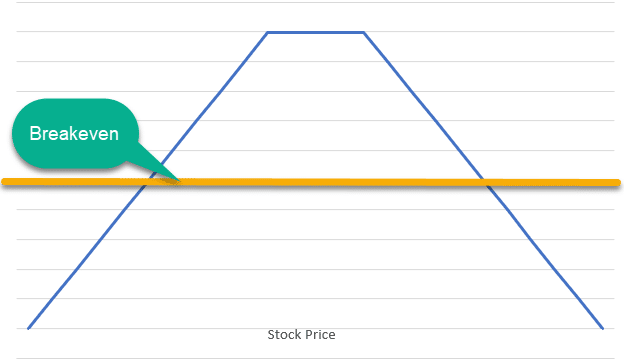
Short Strangle Payoff Diagram
So, if Apple moved up to say $315 or down to $275 before expiration, I’d probably want to take the trade off early and avoid humongous losses.
On the flip side, I can take off this trade at any time and lock in profits early.
Time & Volatility
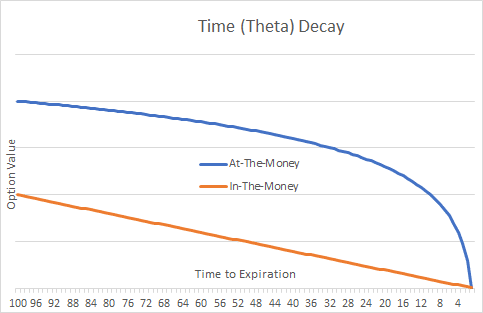
There are two key concepts you need to understand – time (theta) and volatility (vega). Theta is the time decay built into an option. Every day that passes by eats into the price of that contract until it reaches zero by expiration.
This is a chart to help you picture time decay on the price of an option.
Volatility also comes into play. The higher implied volatility, the higher option prices get. Right now, with markets moving all over the place, implied volatility is really high. That pays me more for selling options than is typical.
Now, there is also a risk with volatility. If I sell the options and implied volatility rises, it makes me lose money on paper. At that point, I have to wait for time decay to eat away at the price of the option. However, it can also work in my favor as reductions in implied volatility cut into option prices.
Want to see something really cool? Check out the video around the 7 minute mark. I’ll show you how to look at theta and translate that into how much a position makes per day through time decay.
Choosing the Right Strikes
You have to make a tradeoff when picking out your strike prices. The closer you get to current price, the more you get paid, but the lower your odds of success are. When you go further out, your odds increase, but your payout decreases.
What’s neat about the current environment is the high implied volatility increases the price of options beyond normal. If I tried to sell options that were $30 away from the current stock price during slower markets, I would get paid way less.
For me, I want to take advantage of high implied volatility but reduce my risk. That’s why I chose strike prices that were pretty far away for a lower payout than trying to play with fire on closer ones.
Trade Results – Cash Money
You can look back to see that Apple managed to close last week right in the middle of the strikes, leaving me with a fantastic profit.
This week you’ll be seeing how my current trade worked out.
Now from my video that I made on Saturday, I want you to note the current trade.
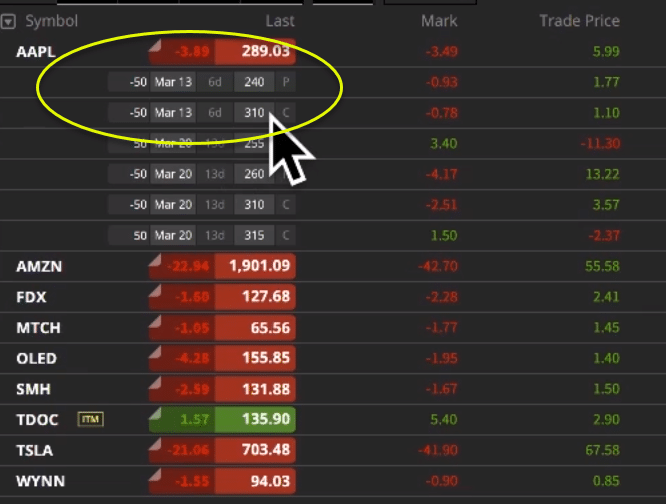
This is the exclusive stream my Total Alpha Members get fed to their computers!
Expiring March 13th, I sold the $240 put for $1.77 and sold the $310 call for $1.10. That’s a total of $2.87 on 50 contracts, for a maximum potential profit of $14,350!
Check out the closing print for Friday and see for yourself how this worked out. Do I put up or shut up?
