Yesterday’s market action was severe. We hadn’t seen a sell-off of that magnitude in over two years. In fact, the last time we saw a 1,000 point down move in the Dow was back in February of 2018.
 And believe me, that wasn’t fun for a lot of traders!
What I find interesting is how pundits compared the start of this year to 2018. And in case you forgot…that was the last election cycle in the U.S.
So does that mean it’s all up and up from here on out?
Perhaps.
But whether you’re looking to buy the dip or sell the rip… you need to know your levels.
Today I’m going to breakdown the VIX, VVIX, and SPY charts. And share with you my insights on where I think this market goes next.
VIX & VVIX
No other indicator works better at picking up market turnarounds than the VIX and VVIX. As a quick refresher, the VIX tells you trader expectations for volatility in the S&P 500. The VVIX tells you the market’s demand on the VIX.
Let’s break this down further. The VIX generally moves in the opposite direction of the market. That’s why you see the VIX spike when the market drops. Traders will buy call options on the VIX to protect themselves against market declines.
Now here’s the key – the VVIX tells you demand for VIX options. So, if the VVIX isn’t making new highs, but the market is making new lows, that means traders aren’t buying call options on the VIX with the same conviction. This can mean that the market is getting close to a bottom.
There’s one other piece of information you need to make this all work. Both the VVIX and the VIX are mean-reverting. That means they like to snap back to the average from their extremes. For the VIX that’s around $15-$18 and the VVIX it’s $90-$100.
I look for the VVIX over $115 and the VIX over $25 as an indication the market is nearing a low. Does this always work? No. But, it works quite often.
You can see how the VVIX already breached $115 and then pulled back during the market drop yesterday.
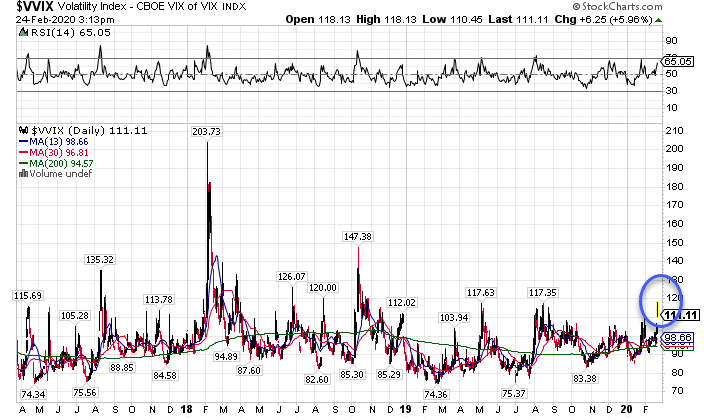 VVIX Daily Chart
This is an important clue that the market has found a bottom. But let’s take a look at the indexes themselves.
Look for previous areas of support
Both stocks and markets use support zones to turnaround. These areas are the highest probability areas for price to stop its downtrend. Is it guaranteed? No. They are simply high probability areas.
Here’s how I like to look for these areas. Stocks and markets like to trade back and forth in a range. When this happens for a while and then takes off, this area becomes support. This was the last place that investors accumulated long positions, so they’re likely to defend them when they return.
When I look at the SPY, I see the following places as areas the market should find support.
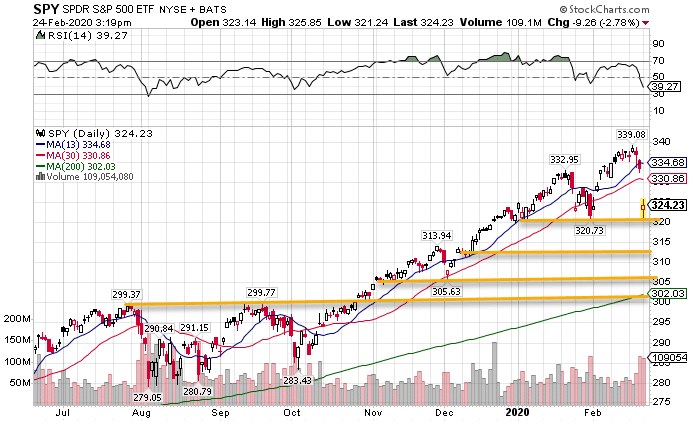 SPY Daily Chart
Each of these areas represents places where the SPY traded in a range, even for a few days. Now I’ve drawn lines for these spots that align with the swing low points. However, price could stop anywhere within that range.
Pro tip – The longer a chart spends trading in a range, the stronger that level becomes. The $300 level should be much stronger than any of the other levels above it.
Big numbers
You might be surprised that a simple concept would work so well. But big, round numbers work really well for support and resistance levels. I don’t know whether it’s because it’s easier to type in those orders or what. Yet, I find they work over and over again.
Notice how many of those lines land at $320, $305, and $300. Price loves to use these big numbers to make turnarounds.
Look at various markets all agreeing
The SPY, QQQ and DIA all like to trade together. Bonds and gold will often trade in the opposite direction. Real bottoms occur when all of these say the same thing.
What does that mean? You want to see intraday reversals in all the major stock indexes AND in bonds and gold. That means stocks reverse to move higher while bonds and gold flip to move lower.
Pro Tip – Expand your view beyond the major indexes. Look to sectors like healthcare (XLV), industrials (XLI), and others to give you additional confirmation of your assumptions.
So where will this market stop?
Right now, the most likely support level looks to be $320 and then $300. Those are two big, round numbers with a lot of reasons to off support for the SPY. That doesn’t mean the market will stop on those numbers to a dime. Rather, they provide general zones to work with.
