The year started off with equities, bonds, and gold all racing higher. An upcoming election painted uncertainty. Yet, Fed policy actions indicated that investors had nothing to worry about.
That was 2008… the peak before the Great Recession.
But what about the present?
2019 saw an unprecedented run in most asset classes… while 2020 looks just as frothy.
All of the markets soaring at once reminds me of past bubbles. While valuations haven’t run rampant in one particular area, the broad lift in the markets concerns me much more.
Consider the following – when investors flee stocks they park their money in bonds and gold for safety. But what happens when they all crash out at the same time? Where does the money go?
That isn’t a scenario you want to live through. But it’s one I must prepare you for.
Today I want to talk to you about risk, which sector faces the most, and how to profit off a potential downturn in the market.
To do that, I’ll be going over charts in GLD, XLF, USO and more.
Financials falter
Last week, I noted that the financials aren’t making new all-time highs. The easy money from the Federal Reserve, along with their balance sheet expansion, continues to drive down bond yields. In turn, that’s making it harder for banks to make money.
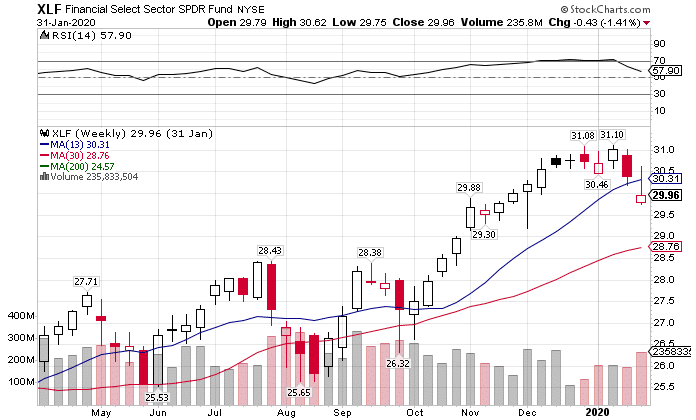
XLF Weekly Chart
In fact, financials closed the week well below the recent highs and the 13-period moving average in the same timeframe.
If that’s not an ominous sign, I don’t know what is.
Gold & bonds banging at the ceiling
While everyone is focused on stocks making new all-time highs, gold and bonds both prepare to break through their resistance areas.
Gold finished the week within pennies of the recent highs in a very bullish position.
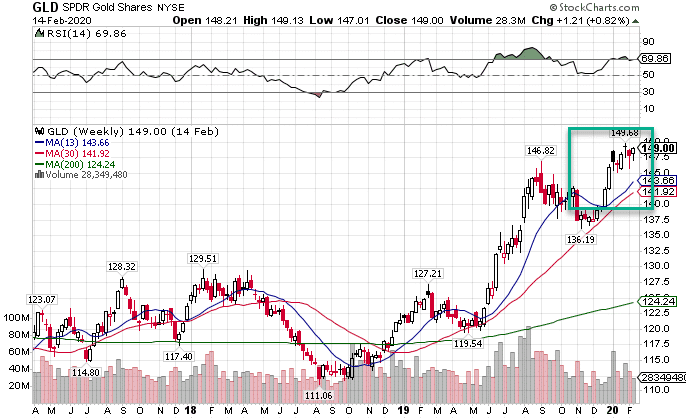
GLD Weekly Chart
When you look at the hourly chart, there’s a clear bullish channel with a series of higher highs and higher lows.
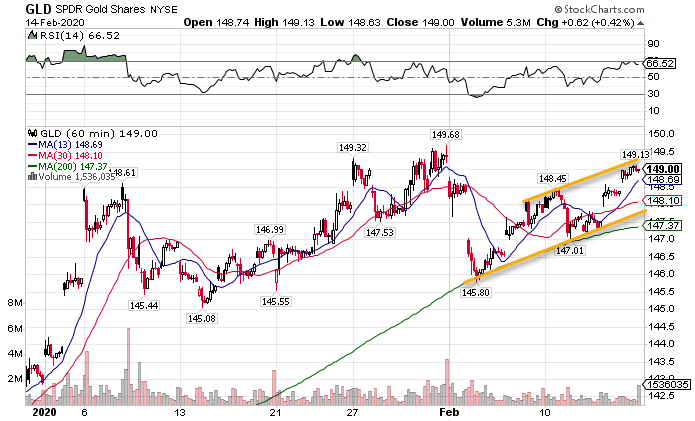
GLD Hourly Chart
I don’t see any reason gold won’t push through the old highs in the next few weeks. With stocks overextended, even if they melt-up further, the ensuing pullback should push the GLD through the round $150 level.
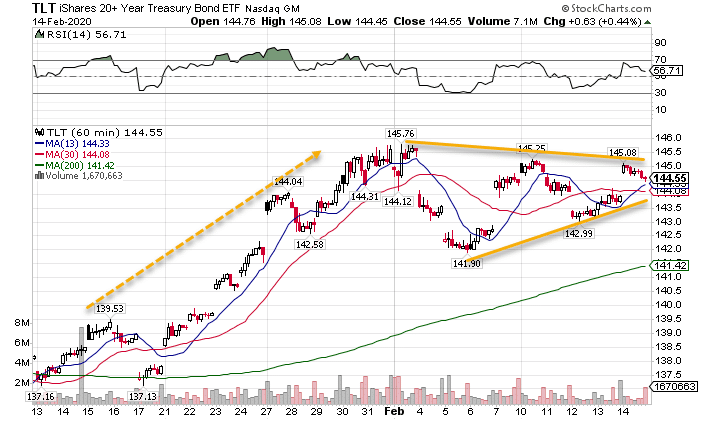
Bonds draw out a different pattern, but a really cool bullish chart.
TLT Hourly Chart
What’s really neat is how this chart reminds me a lot of Nathan Bear’s TPS setups. Price exhibits a clear bullish trend. Then, it moved into a wedge consolidation where the range contracts more and more.
Once the range squeezes to a point, I expect we’ll see a sharp push higher in bond prices. Since stocks and treasuries often move in opposite directions, that doesn’t leave me with a good feeling for equities.
Energy rebound
Oil and natural gas face a lot of headwinds. Both experienced staggering selloffs in the last couple of months. Yet, the tide could be turning for these commodities.
Crude oil’s chart shows a double bottom forming that could lead to higher prices for black gold in the coming weeks.
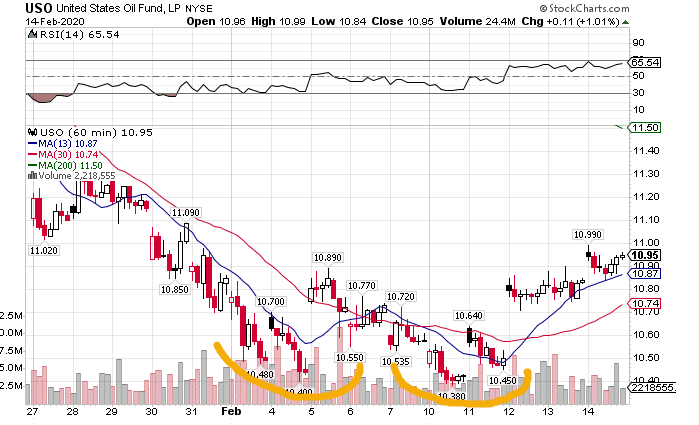
USO Hourly Chart
The long-term outlook hasn’t changed, but the oversold conditions should lead to a bounce for a few weeks.
Similarly, I’m seeing natural gas form a base.
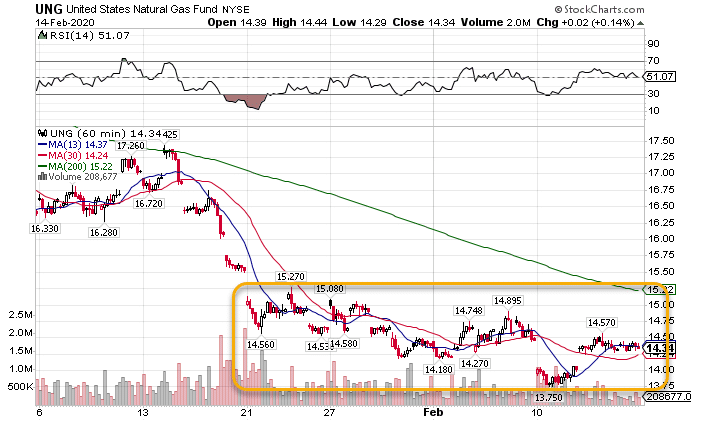
UNG Hourly Chart
While it doesn’t have as clean of a bottom as oil, it should get a sympathy rally if crude begins to take off.
That could give the SPY some life. Remember, a lot of the drag in the S&P 500 came from horrible results from energy companies. If commodity prices rise, that could change their outlook and boost the index.
How can we tell if this is true? Look for relative outperformance of the SPY to the QQQ. With the more tech-heavy QQQ, rising energy prices won’t help boost its ETF price.
Dollar domination
Anyone who thought the dollar’s days were numbered feels the scorch marks on their face from the greenback’s recent move. After a short pullback to the 200-period moving average on the daily chart, the U.S. Dollar took off like a rocket to pass its old highs.
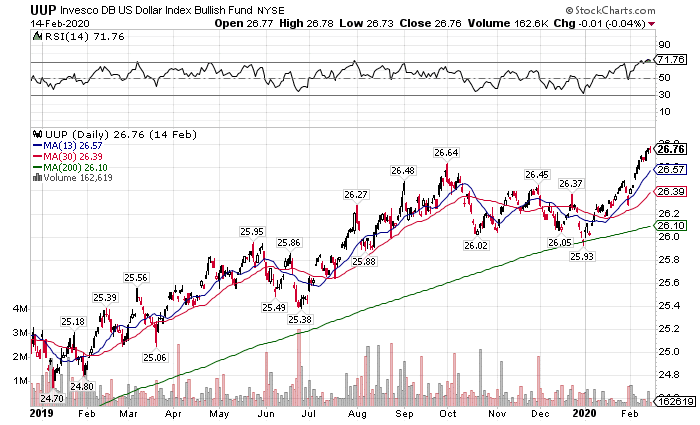
UUP Daily Chart
The main dollar index is now just above $99. We’re getting really close to $100 for the index, which is known as ‘par.’ We last saw that in 2017 and will likely see it in the coming months.
Here’s where to play
Volatility contracted the last few weeks as stocks rose. That makes options cheaper to buy. I’ve already taken a few swing trades using this idea. In fact, it’s how I position my Bullseye trade of the week.
There’s still a little momentum left to the upside that should play out within days to weeks. During that time, I’ll be keeping my eye on key momentum stocks like CMG, RH, and others. However, I am and plan to be long gold for the foreseeable future.

