You don’t come across a picture-perfect setup every day. Yet, the top in IBM the other week was about as good as they come.
I scoped out this trade in Total Alpha, and took a quick $4,000 profit in just a few days!
In fact, this trade was so ideal…so special…that I didn’t just want to create a newsletter around it…I wanted to make a trade review video!
This trade review explains not only how I identified the setup, but how I set up the trade itself. You’ll see how I picked out my stop areas and defined my risk with a credit spread.
So without further adeiu….
Enjoy this video review to go along with the analysis below by clicking here.
Breaking down the chart
Let’s start by looking at the hourly chart.
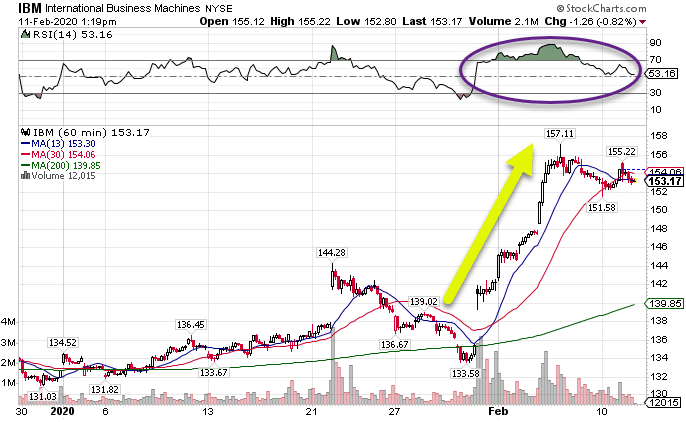
IBM Hourly Chart
This stock rarely moves…and I mean rarely (it’s almost the same price it was 20 years ago!) After a monster run from $130 to nearly $160, it appeared overblown, much like the Tesla move.
Now, you’ll notice at the top that I highlighted an area of shaded green. This is the RSI (relative strength index) indicator. It’s a useful tool that helps me identify when a stock is overbought of oversold. A reading above 70 indicates overbought and below 30 is oversold.
In this case, it read 90. That’s an overbought condition that says to me it’s going to stop.
Key Insight: Stop doesn’t mean sell off! It just means stop!
You can see how it also tested this same level multiple times around $156 but couldn’t breakthrough.
When you have these couple of items together, it sets up a good probability trade.
Setting up the trade
Remember the key insight – I only expect this stock not to go higher. That means the optimal setup for the trade is a call credit spread.
A call credit spread involves selling a call option at one strike price and then buying one at a higher strike price. That pays me a credit. My goal is to keep as much of this credit as I can by expiration. If the stock hits expiration at or below the lowest strike price, I get to keep the full credit.
Here’s how the trade laid out:
- I sold the $155 strike price call options
- I bought the $160 strike price call options
- I got paid $2.10 for creating this trade
Two things to remember. First, the options always have the same expiration and work on the same symbol. Second, I want to sell the lower strike price option and buy the higher strike price option.
Now, the maximum I can make on this trade is $2.10 x 100 shares per option contract = $2.10. The most I can lose would be if the stock closes at or above $160, which would be the distance between the strikes less the credit I received.
Maximum loss = $160 – $155 – $2.10 = $2.90 x 100 shares = $290.
What’s neat about these trades is that you can take them off before expiration for a partial profit or a partial loss. That gives you control on how you want to play the trade. In fact, statistically, you increase your average earnings per day when you take these types of trades off at 50% of maximum profit.
My execution
As I mentioned, my maximum possible loss was $290. However, when I use the chart, I know that $156-$157.11 is the critical resistance level. If the stock closed daily above that level, I could exit the trade for less than maximum loss.
For me, I got paid $2.10. I closed the trade early (which I almost always do). When the opportunity arose, I exited the trade (covered the position) for $1.28. That’s a profit of $0.82, or around 40% in just a few days.
Keep in mind this trade still had weeks until expiration!
With this trade, I used 50 contracts. That’s a total profit of $4,000 in a matter of six days by not having IBM go higher. It was simple and painless. In many cases, I will enter my exit trades at the same time I execute my entries. You can’t get much more hands-off than that!
