Everybody and their brother wants to know when the market will make the next major turn.
Pick tops and bottoms is the holy grail of trading that no one seems to know ahead of time, but everyone claims they knew in hindsight.
I found a few techniques over the years that identify possible tops in both stocks and indexes.
When you combine them with other indicators and analysis, they do a darn good job of highlighting resistance levels.
In fact, one of them came up with the exact level that the SPY stopped at!
Look, trying to pick off-market tops is a fool’s errand.
Yes, when you time it correctly, there is a windfall of cash to be made quickly. But, you’re more likely to get swallowed up in the perpetual grind then walk away from a winner.
However, every piece of information that supplements your trading increases profitability.
Today I’m going to teach how to apply key support and resistance levels to improve your entries and exits.
Market Symmetry
One of the most popular methods to find resistance in stocks and indexes is through market symmetry. While everyone uses this technique slightly differently, I’m going to explain how I use them.
Market symmetry uses pattern movements to project where the final stop would be on a current move. At its core, you’re taking a previous move and adding it on to a current move.
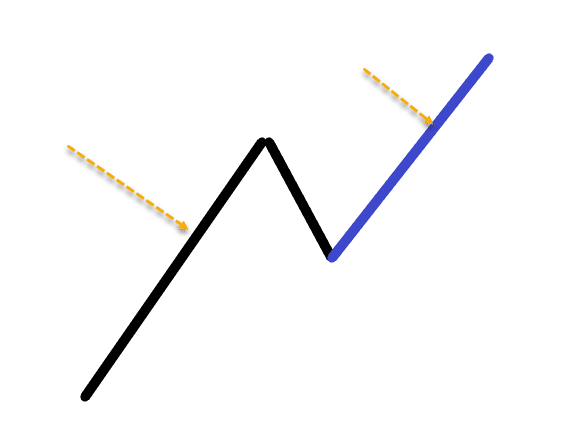
Let me draw it out for you. Assume for a moment you have a stock that pushes higher, then makes a pullback.

The first, long line is the expansion move. After that, the short line is the pullback. Symmetry would say that when you take that first line and then add it onto the end of the second leg, you find where the stock’s price would end.
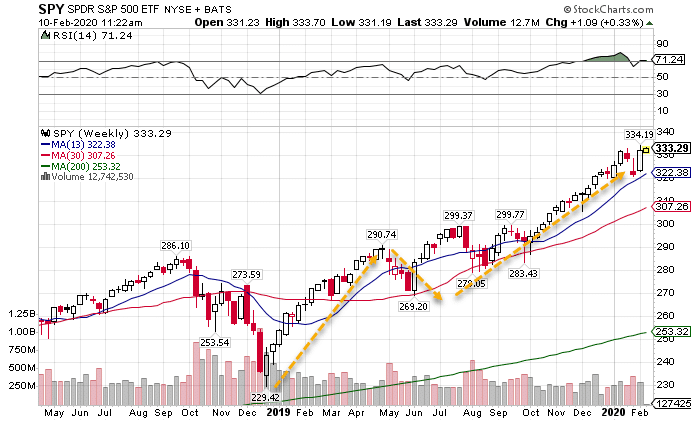
Here’s an example using the SPY.
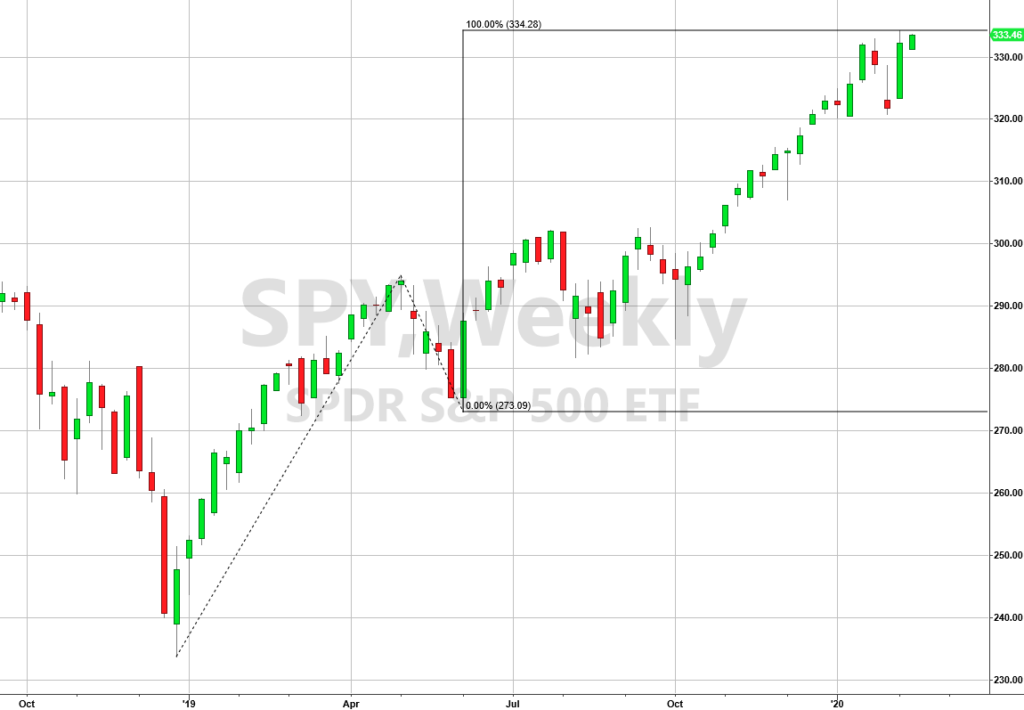
SPY Weekly Chart
Let’s break down the price movements here. The first move went from $233.76 – $294.95. That’s a distance of $61.19. SPY then pulled back to $273.09. If you add on $61.19 to $273.09, you get $334.28.
The top for the market came in right around $334. Pretty crazy, right?
I draw these several different ways to see which ones make sense. When you get several of them that all point to the same area, you know you’ve found something.
Now, let’s consider the next step to this analysis.
Fibonacci Extensions
Fibonacci extensions use common Fibonacci percentages to find additional levels beyond symmetry.
Essentially, symmetry is a 100% extension of the Fibonacci. However, you can add in other common percentages such as the 23.6%, 38.2%, 50%, 61.8%, and 78.6% levels. You can also add these beyond the 100% level to get levels as well such as 161.8% level.
Here’s how you might use it on the TLT bond ETF chart.
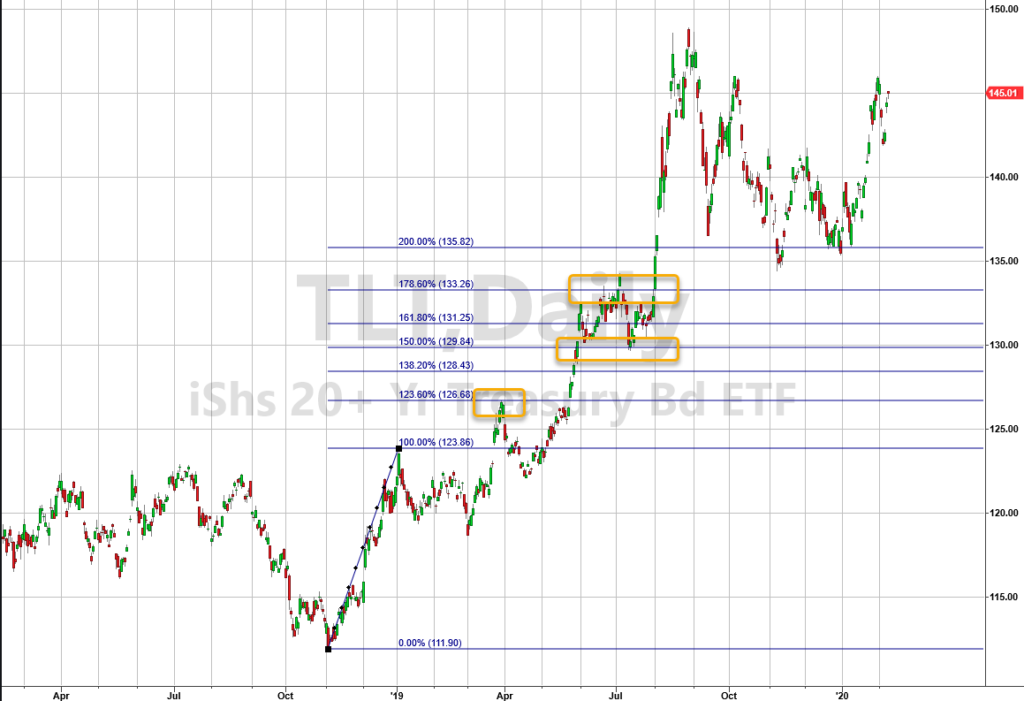
TLT Daily Chart
What’s neat is that these tools work on any type of chart and any product. Sometimes these levels only act as resistance intraday. Other times they work for weeks. Unfortunately, you don’t really know which it will be without considering other pieces of your analysis.
Bollinger Bands
One of the coolest tools out there has to be Bollinger Bands. They provide a range that says, ‘based on historical closes, there is a 95% statistical chance that the stock closes within this range.’
It’s a great indicator to look for charts that are overbought or oversold. This indicator works based on the timeframe you’re looking at. So, if you use an hourly chart, you’ll find hourly resistance.
Here’s a great example with the QQQs.
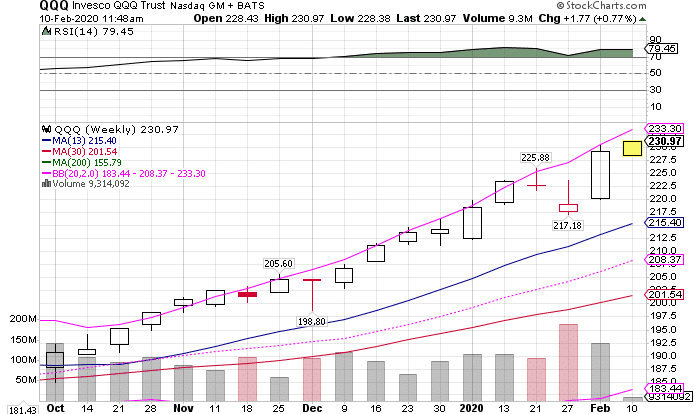
QQQ Weekly Chart
Check out how the upper Bollinger Band (pink line) really kept a cap on the QQQs. It takes a lot for an entire index to push up past that level.
Now, it’s worth noting that when a stock starts closing regularly above or below a Bollinger Band on any timeframe, it’s usually best to wait for it to move back inside the bands.
Think about what it means for a moment when a stock starts trading consistently outside the bands. That means it’s getting bought or sold more than the closing price would dictate 95% of the time. In layman’s terms, there’s a lot of pressure being applied.
Put these together to make a powerful trading strategy
When you add all of these together, you get a well-rounded trading strategy that gives you an idea of when and where stocks should find support and resistance. That tells you ahead of time where there’s potential entries and exits.
I use these techniques to help me identify key spots that work well for option credit spreads. It’s a strategy I love employing because it has such an exceptionally high win-rate. That’s why I set my 2020 Total Alpha goal of consistent income.
