Markets ran back to their all-time highs, climbing a wall of worry emanating out of China. Despite no resolution for the coronavirus— and a death toll that now exceeds SARS— investors continue to push this market up.
However, safe-haven investments continue to rise alongside equities, which makes me question what’s really going on here.
If gold and bonds continue to propel higher, are institutions still betting on stocks… or has this recent move back to highs… just a fakeout?
I don’t trust the news to give me answers. And now is not the time to be relying on gut feels… Instead, I’m going to put my faith in what’s helped me make millions in this market.
Today, I’m going to breakdown the most important charts of the week— TLT, QQQ, VIX, USO, and GLD.
This will allow you to get a big picture view on the overall markets and get a better understanding of where the big money is flowing into.
Technologies King of the Hill
Despite lackluster earnings reports in a handful of cases, most companies came out with solid growth in both revenue and earnings. Apple continues to dominate the global marketplace, expanding beyond smartphones. Amazon breaks the wills of naysayers. And let’s not forget Elon Musk who bathed in the tears of short-sellers.
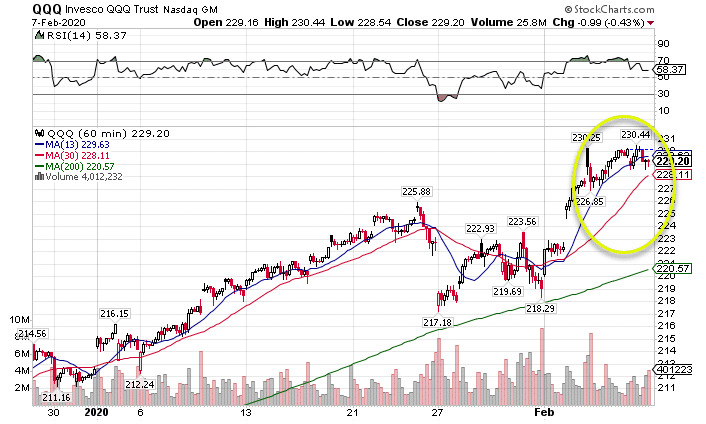
QQQ Hourly Chart
It almost sets up for the perfect storm of too good to be true. I’m watching the potential crossover in the 13-period and 30-period moving average on the hourly chart. With Monday market action fast approaching, the QQQs better get a move on before they ring the death bell.
Given that the index already used the 200-period moving average as support twice, the third time might break the back of the gravitational line. When the leading general falls from his horse, the rest of the cavalry might retreat.
New Highs But With More Fear
Several weeks ago, markets stood at roughly the same spot. The difference now – fear sits on every investor’s shoulder. Before the last market run, the VIX sat at a paltry $12. Now, we’re walking into the week with the VIX up above $15, nearly 30% higher.
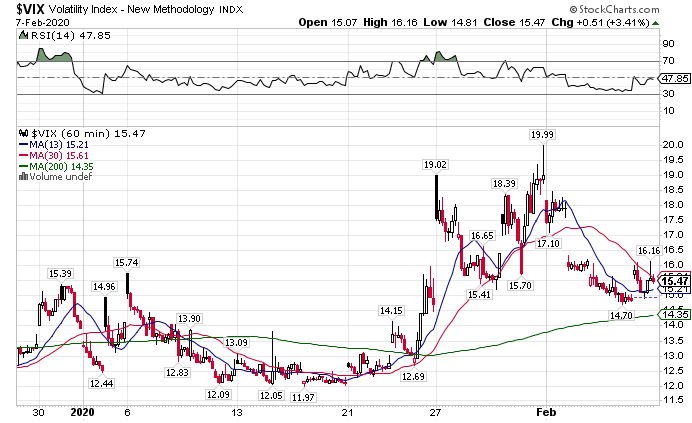
VIX Hourly Chart
The volatility index has yet to test the gravitational 200-period moving average. When you have markets back at their highs with elevated volatility, that doesn’t generally mean the next leg of the bull market is about to start.
In fact, the fear trade seems to be well underway in several other key sectors.
Bonds Delight The Fed
If the Fed worried about rising interest rates, their fears have been quelled by the bond market. Bond yields continue to fall as prices rise, pushing treasury notes back into record territory.
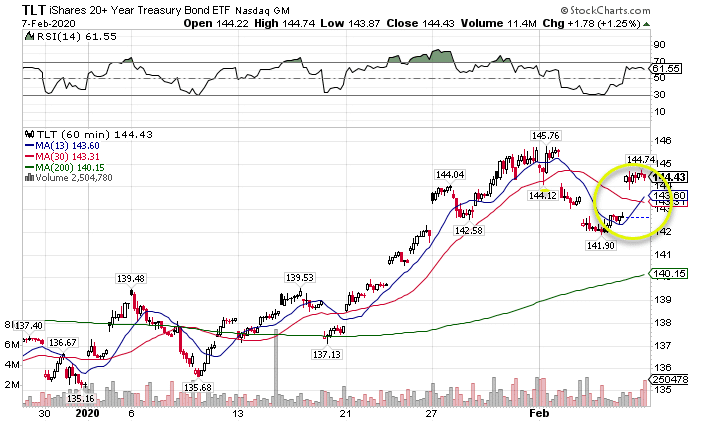
TLT Hourly Chart
Just last week we got a ‘money-pattern’ crossover in the TLT. I had already positioned my Total Alpha portfolio to take advantage by selling a put credit spread the week before.
I think this market has much further to go and could easily take out the old highs set in early February. Whether that takes down equity prices or not remains to be seen.
Cracks in Gold?
After a monster run on the equity selloff, gold took a bit of a breather. Now that it’s gathered some strength, the yellow metal looks like it wants to break through its previous highs.
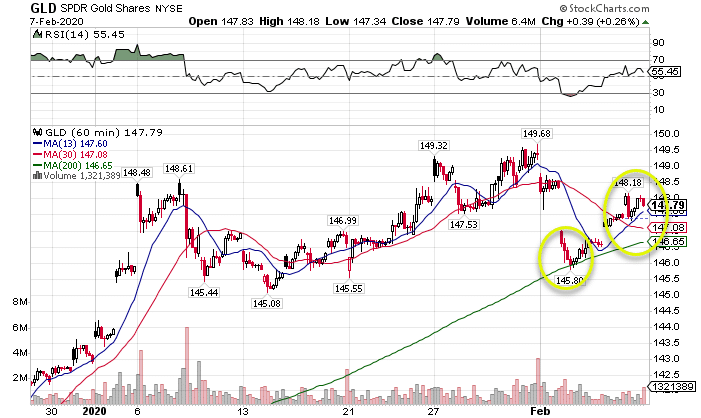
GLD Hourly Chart
We already saw the hourly 200-period moving average act as support. Now that we’ve got another ‘money-pattern’ crossover on our hands, I think it could be a matter of weeks before the GLD takes out the $150 level.
Again, whether that means we get an equity selloff remains to be seen. But when you have two natural hedges to weaker stocks pointing upward, it makes you wonder if the most recent run in the indices is just a head fake.
Energy Continues to Falter
Despite rig counts falling off and potential bankruptcies across the shale beds in the U.S. natural gas prices continue to crater, while crude oil can’t seem to catch a bid.
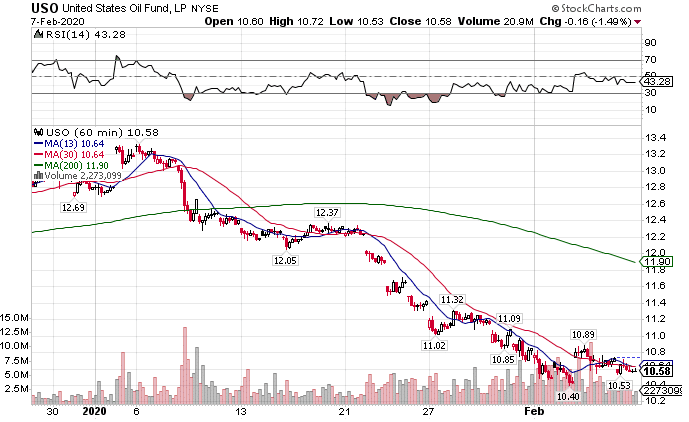
USO Hourly Chart
The scary part is that if the supply chain’s in China really slows down, the demand for black gold could take a hit. With an abundance of supply and already weak demand, the outlook remains grim.
In a larger political context, this could cause problems for petroleum states that heavily rely on the price of commodities. Aramco’s IPO already came in below initial estimates, and the coffers from Russia to Iran continue to suffer.
At this point, the industry needs a fundamental shift. We’re talking about massive bankruptcies or some other clearing mechanism that sweeps out the unprofitable suppliers in the industry. Only then will things begin to stabilize.
I Like Neutral Trades Until We Get Clarity
Right now, I’m gearing my Total Alpha portfolio towards a neutral stance. Instead of taking substantial one-way bets, I’m playing iron condors and credit spreads, letting time and volatility decay work in my favor.
It may sound foreign to you. But trust me, this strategy not only demonstrates high statistical success rates, but it’s also much easier to manage than your average trade.
I’ve got a whole host of goodies just waiting for you at Total Alpha.
