This week is shaping up to be another rodeo. My read on the markets…we’re just getting started. We’re in for sharp rallies and steep drops.
Dow futures were up this morning, despite heavy selling pressure coming out of China, which saw its stock market drop by as much as 9% after reopening from the Lunar New Year holiday.
No, this isn’t some short pullback that works itself out by Friday. We’re in for a ride that is going to last for weeks, if not months.
What does every trader need to know right now?
LEVELS.
As in support and resistance.
Today I’m going to breakdown key levels in the SPY, GLD, TLT, USO, UUP, and much more.
An Eye on the SPY
A Total Alpha member recently asked me why everyone looks at the SPY. The SPY is the most traded, liquid, and popular ETF out there. It tracks the S&P 500, which most view as the best measure for broad US market health.
Friday’s selloff hit the SPY index hard, even with Amazon turning in a stellar performance. When you have a major index component up massive on the day, and the market is still down hard, you know this selloff is the real deal.
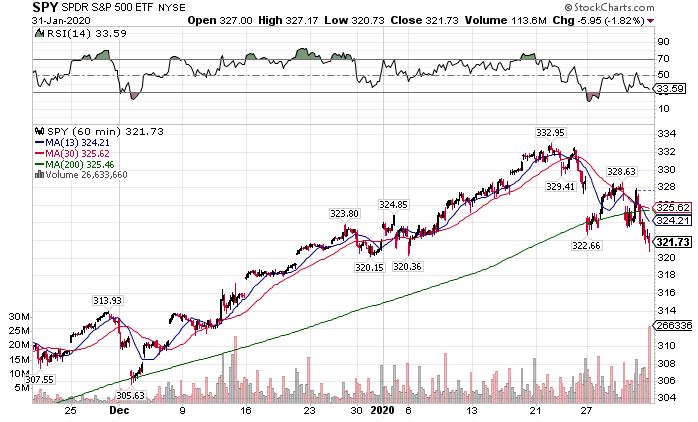
SPY Hourly Chart
While I initially thought $320 was good support, I now believe we’re headed to $310 before we find a real bottom. That doesn’t mean we won’t get sharp rallies in between. $317 should be support for at least a little while.
QQQ Needs To Play Catchup
Last year’s outperformance by tech makes it susceptible to sharp selloffs. If investors really want to hide their money, they’ll pull it out of growth and drop it into safety.
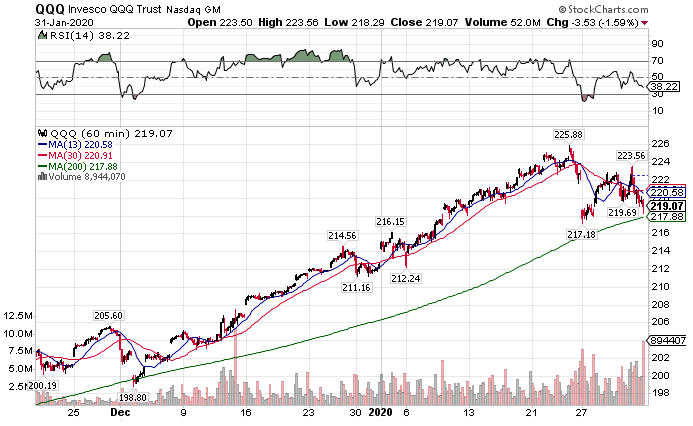
QQQ Hourly Chart
With Amazon propping up the Qs last week, we could see a decline down near $212. That could wipe out a lot of wealth pretty darn fast. Some of the biggest risers – AAPL, NVDA, GOOGL – could be the biggest losers.
I already started playing call spreads against some of the high fliers, while dropping some put credit spreads on select names that I still like in this downturn.
Gold’s A Good Bet During the Selloff
Investors love to park their money in ‘safe haven’ assets like gold and bonds during selloffs. So far, gold hasn’t taken off the way I would expect for this kind of drop. However, I think that will change in the coming months.
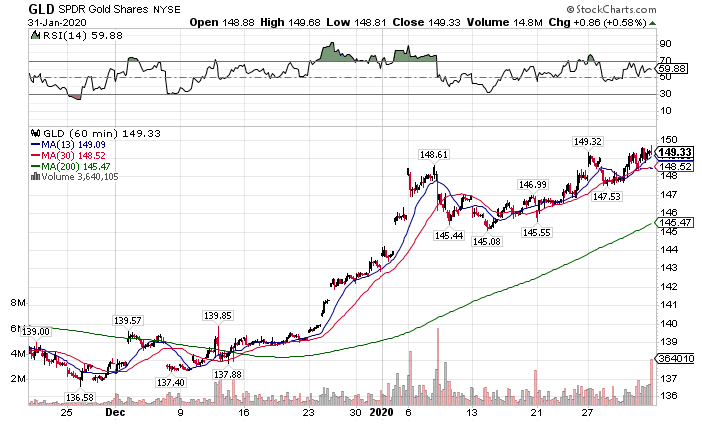
GLD Hourly Chart
I plan on using pullbacks in the GLD to load up some call options. But, if you want a little more bang for your buck with a bit more risk, gold miners are your sugar daddy.
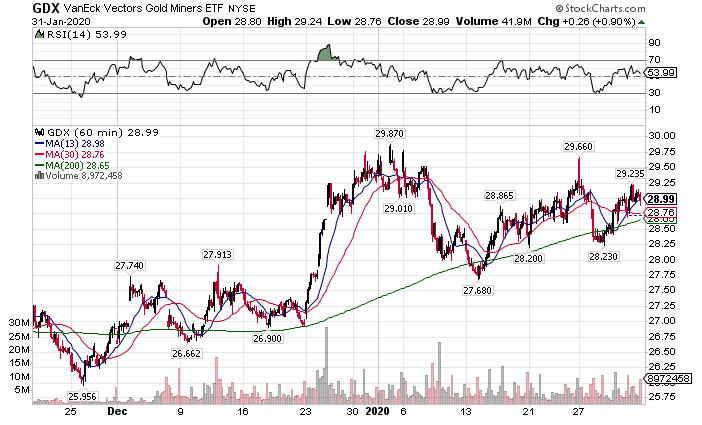
GDX Hourly Chart
The only problem with the miners is they can get swept up in equity selloffs. So, it’s a touchy one to play.
Long Bond But Short The Dollar
Here’s an odd one for you. Usually, selloffs lead to rising bond prices and a rising dollar. However, bonds are the only ones looking good lately.
Bonds worked quite well during the Friday selloff, finishing up nearly 1% on the day.
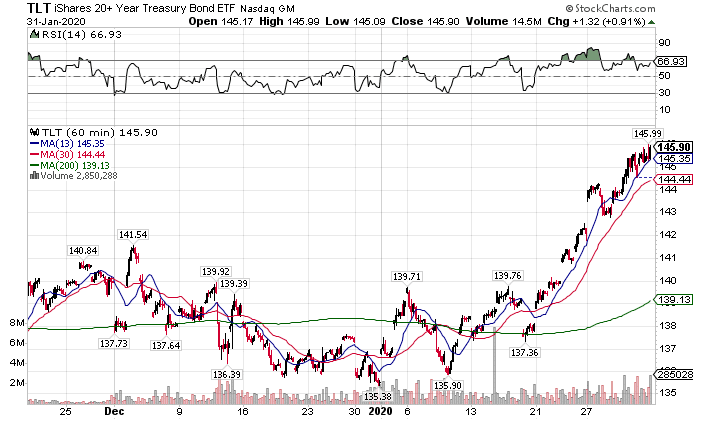
TLT Hourly Chart
On the flip side, the dollar finished down half a percent.
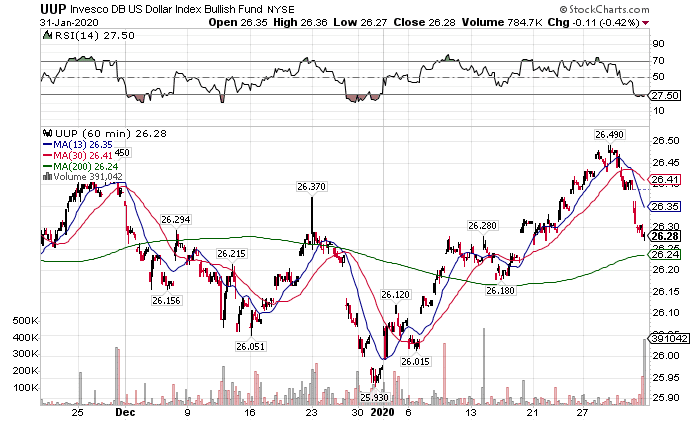
UUP Hourly Chart
My read is that investors are betting on more QE from the Fed to weaken the dollar. That would lead to higher bond prices and a lower dollar, which is what we’re seeing.
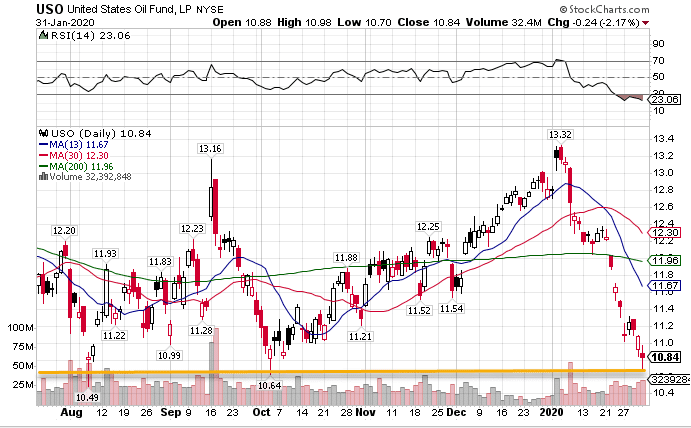
Crude Is Down But Not Out
Downturns don’t spare commodities that thrive on global demand. However, crude oil doesn’t have the same downward trajectory as equities.
Yes, it was down on Friday over 2% with equities. But, it’s coming into a strong triple-bottom area.
USO Daily Chart
If crude starts closing below this trendline, then it’s got way lower to go.
I also want to comment on some articles that came out discussing the secular decline in oil. They make the argument that the push towards clean energy will send oil to lower levels than we see now.
These folks present a compelling case. While I don’t know that we’ll see the dramatic turn like when crude fell off during the fracking binge (outside of a technological change), this story is real. Simply put, it makes good business sense these days to go green for a variety of reasons.
The IPO Disconnect
Ben Sturgill knows IPOs like the back of his hand, and trades them constantly with IPO Payday. It’s not a bad place to be for a trader in this type of market.
IPO stocks tend to trade on their own, regardless of the broader market. You need look no further than LUckin Coffee (LK) coffee this week. They are a Chinese coffee chain. Yet the stock only tanked when it had news of potential fraud.
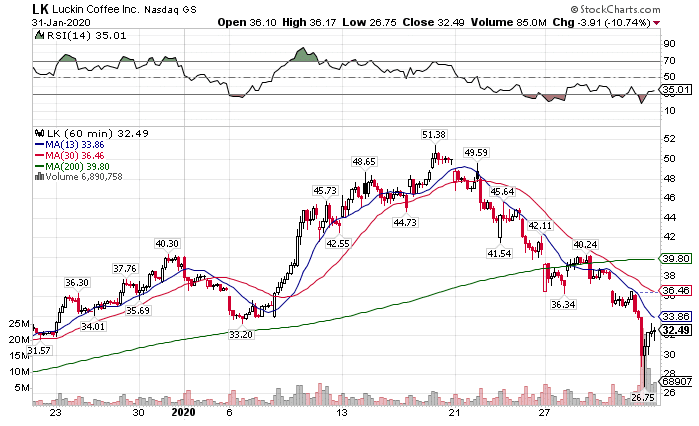
LK Hourly Chart
Here’s what’s noteworthy – while the rest of the market failed to bounce, LK made a sharp reversal midday. We’re talking about a Chinese coffee chain reversing in the face of Coronavirus news…
That’s why I like to trade with momentum stocks. They work fantastic for this kind of environment.
Quite honestly, there’s no one better than that than Nathan Bear.
This Tuesday he breaks out his new LottoX series, aimed at short-term trades with big payoffs.
He’s hosting a live session at 2 P.M. that you don’t want to miss.

