Yesterday may have been a rough day for some traders, as the S&P 500 declined by 52 points, -1.58%, on fears that the coronavirus could weigh down the global economy.
But it didn’t have to be. In fact, I actually made over $24,389 from trading options.

And while yesterday was the first volatile trading day of the year. I am ready for anything… whether it’s a bounce or continued sell-off.
I’ll be alerting Total Alpha subscribers on my game plan and trades throughout the day.
While the market tries to figure itself out, I want to take this time to talk to about an options trade I had on Amazon a few days ago.
But this time, we won’t be talking about options at all.
Instead, I want to discuss something called the Life Cycles of a Stock.
Study it, and you’ll be on your way to adding more 0’s to your bank account.
Breaking Down The AMZN Trade
Iron condors combine a put credit spread and a call credit spread. This creates the ‘wings’ of the trade.
Here’s a quick example.
- Stock ABC trades at $100
- You sell the $110 call contract and buy the $115 call contract
- Then you sell the $90 put contract and buy the $85 put contract
- You will receive a credit for this transaction
The goal is to get the stock to land between the closest strikes at expiration, in this case, $90 and $110.
Now, I bring this up because I want to explain a little trick here. You don’t have to execute this trade all at once. Instead, it’s perfectly acceptable to start with a call credit spread and then add the put credit spread later on or visa versa.
You’re probably asking – why would I do this?
Well, the closer you are to the strikes, the more you get paid for that portion of the trade. If you have a range bound stock, you can start with one side of the trade, and add the other one when it gets closer to the other end.
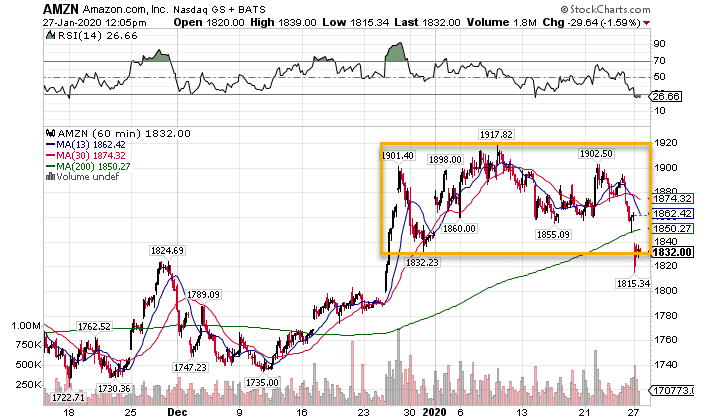
Let’s use the Amazon trade as an example. The hourly chart highlights an area where the stock traded in a narrow range for the last month.
 AMZN Hourly Chart
Imagine you were just trading the stock. If you saw a stock stuck in the range, you would sell at the highs and buy at the lows.
That’s basically what we’re doing here but with credit spreads. When Amazon made its first drive higher up to $1900, I took that opportunity to sell a call credit spread. That paid me a good chunk of change since I was so close to the strikes.
When the stock dropped down to $1832, I sold the put credit spread. After that, I simply waited the trade out.
Because I used the swings in price to get fatter payouts on the credit spreads, I not only reduced my overall risk but increased my earnings. This is how you combine timing and chart analysis with credit spreads.
But the real secret is leveraging a stock’s life cycle.
Using Life Cycle Analysis
I recently did a live event where I explained the three stages of a stock’s life cycle. These are the churns it goes through as it wiggles its way higher.
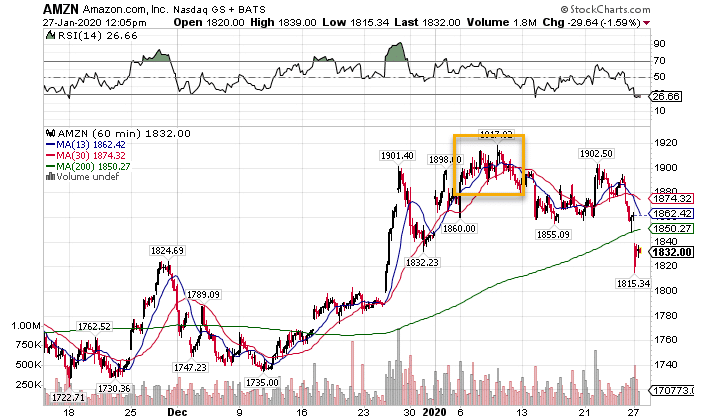
First, stocks go through a reversal. This doesn’t break the longer-term trend. Instead, it creates a short-term turn. I use these to time when I sell the put or call spreads at the tops and bottoms of the ranges. You can actually see this in action on the AMZN chart in mid-January. The crossover of the 13-period moving average below the 30-period moving average signaled a reversal move lower.
 AMZN Hourly Chart
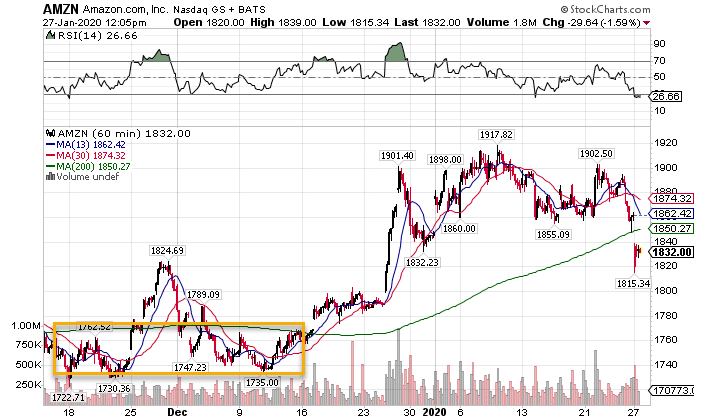
Second, we have the reset areas. After a significant run, stocks like to pull back below their 200-period moving average. These make great places to sell put spreads underneath to eat up the clock. You can see that type of move from November through December in AMZN.

AMZN Hourly Chart
Lastly, there’s the launchpad. This happens when that same stock breaks out above the 200-period moving average and gets ready to take off. This shows up on the AMZN chart in late December.
 AMZN Hourly Chart
Knowing these three phases to the stock’s movement is essential for timing your trades.
You can check out some more examples of the lifecycle in my video replay.
