Hold on to your knickers cause the markets are about to take us for a wild ride. With futures pointed to a massive decline at the open, we need to look at what’s in store for the indexes
The Federal Reserve delivers its first announcement of the year on Wednesday. Hamstrung by a fragile market and jawboning politicians, they’re widely expected to leave rates unchanged. The open question – will they soothe scared investors?
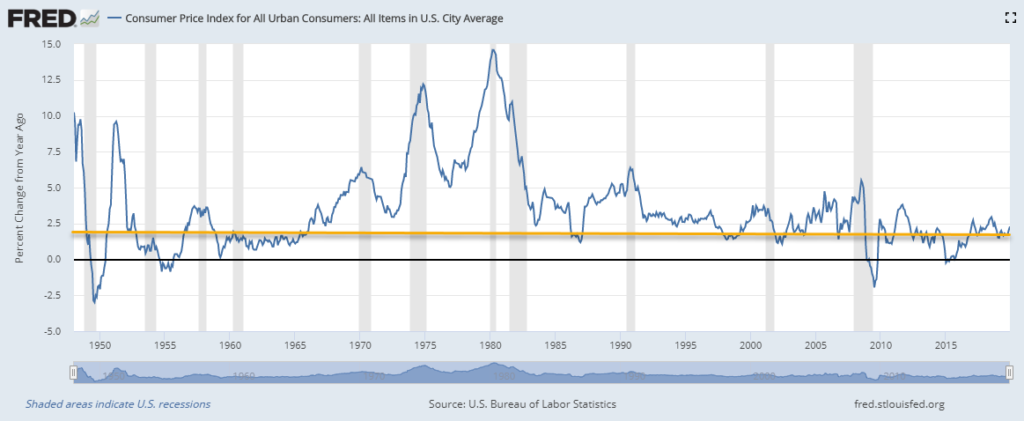
Jerome Powell already upended economists by allowing for U.S. inflation to rise above its 2% mandate – a statement that probably has Adam Smith turning in his grave.
Interestingly, we’ve managed to stay below historical levels, with the one exception being the period from the late ‘50s to the late ‘60s.
This leads me into the bond market as our first stop this week…a place that could rise further than we’ve seen already.
Bright Bond Outlook
Normally, I stick with the hourly chart when I look for setups that fit my money-pattern. However, the weekly chart for the bond market looks fascinating.
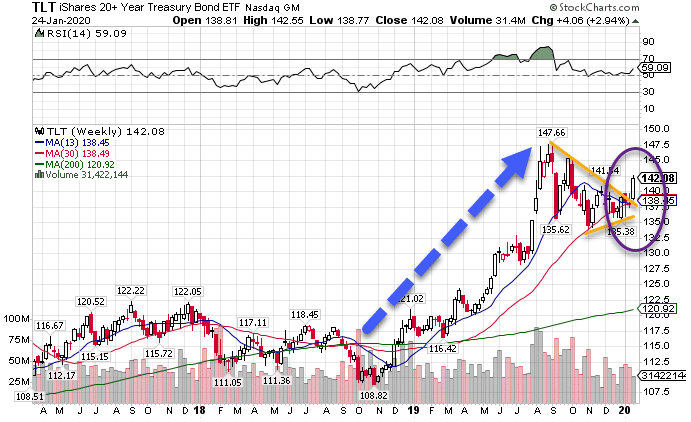
TLT Weekly Chart
Last week the bond market closed above the upper trendline that connected the high points of the candles since August. That signals bonds want to break higher out of this consolidation range.
Supported by an easy Fed, bond demand remains strong. With zero and negative interest rates around the globe, it’s an easy choice for investors. Plus, when the market finally pulls back, its inverse relationship with bonds will give it an extra push.
Markets Fired a Warning Shot
Friday’s close was different than the ones we’ve seen over the last month or so. Stocks traded weakly all day, closing in poor fashion.
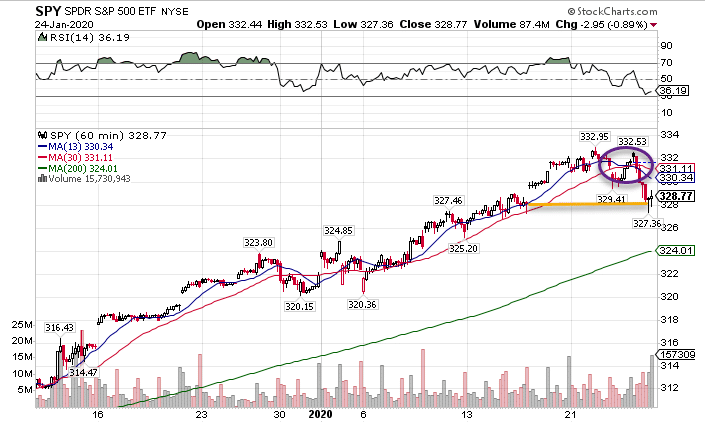
SPY Hourly Chart
I first noticed the bearish money pattern crossover Friday where the 13-period moving average crossed below the 30-period moving average. Then, the market proceeded to fill the gap, and not only close at that level, but below the past couple of days. This is known as an ‘engulfing’ candle. When it happens like this at highs, it’s a bearish reversal.
The Nasdaq didn’t look as bad. But, it’s dangerously close to making a bearish crossover as well.
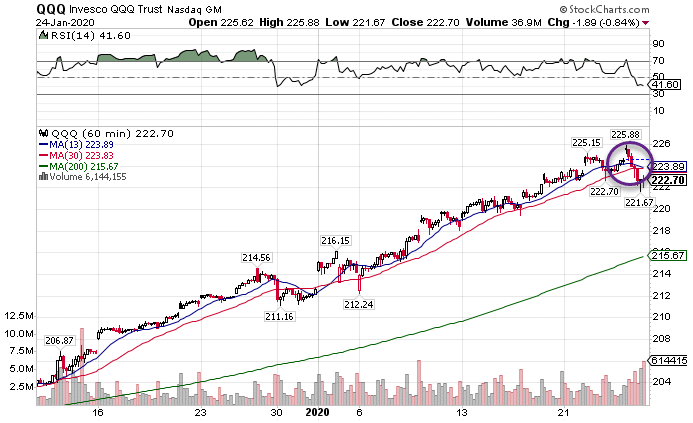
QQQ Hourly Chart
Now you may ask, why would this bearish crossover be any different than the light pullback we got at the end of December?
The difference is how it occurred. December’s ranged didn’t extend as far as this decline in a single day. The entire move in December was 1% from top to bottom over two days. Friday’s was 1.55% in a single day.
But let’s look at the other evidence out there.
A Significant Rise In The VIX
Back in December, the VIX hardly budged as the market rolled over. Compare that with what Friday’s move looked like in the VIX.
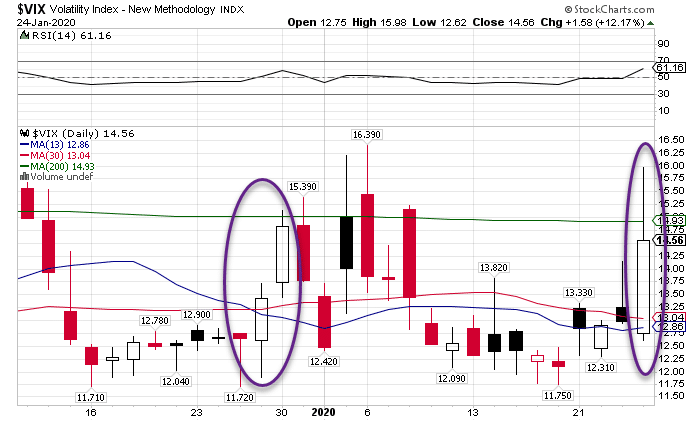
VIX Daily Chart
The strength behind this move was more powerful than December’s. The only saving grace was that it didn’t close above the 200-period daily moving average Friday. But I think that is only a matter of time.
Another point in favor of this decline comes from the VVIX. The VVIX, which measures demand on the VIX, actually declined on the rise in the VIX at the end of December. Friday the VVIX climbed alongside the VIX as markets fell.
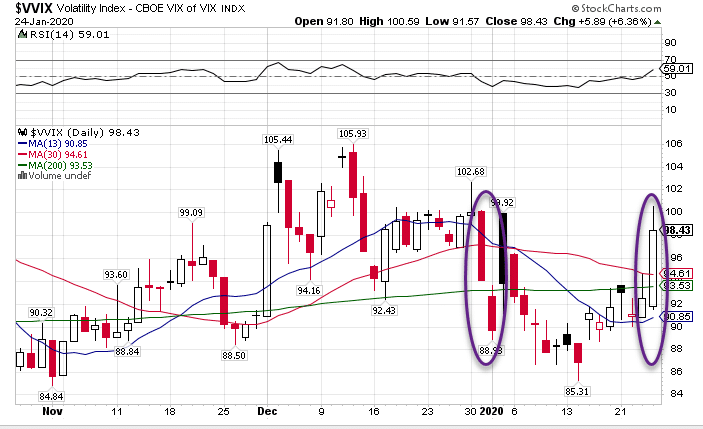
VVIX Daily Chart
This is more indicative of a sustainable pullback. It would make sense given how in 2018, markets ran straight up for a month before pulling back. We’re pretty close to that timing now.
Gold Looks Glorious
I added call options in the GLD last week to my Total Alpha portfolio. Gold’s chart depicts a bullish market ready to break higher.
When I look at the hourly GLD chart, I see a bullish crossover as well as a consolidation pattern near the upper end of the trading range.
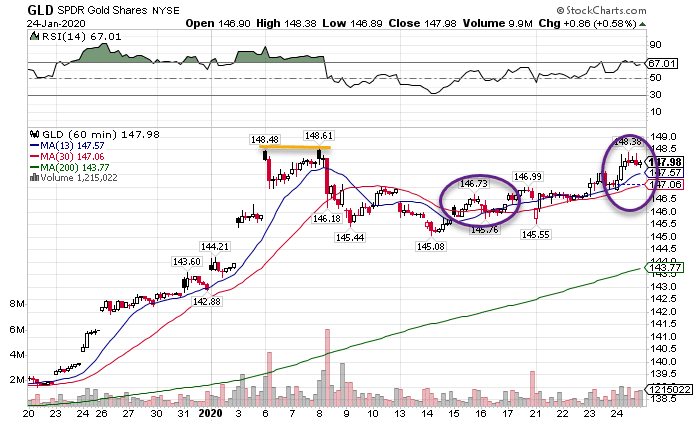
GLD Hourly Chart
GLD came close to touching the hold highs Friday. The longer it hovers here, the more likely it breaks through to much higher levels. A downdraft in the markets would certainly help this along.
Crude Looking For a Bottom
I’ll admit I’m surprised at how far crude has fallen. However, that aligns with why I would expect a pullback in stocks.
At this point, crude oil will want to test its previous lows. In the USO that coincides with $10.50-$11.00. Breaking those levels would require a lot more selling pressure than we’ve seen so far.
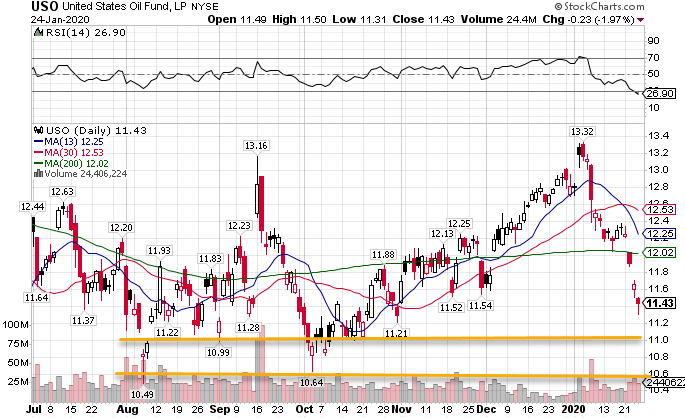
USO Daily Chart
Part of why I’m looking for a bottom in crude oil is its volatility. Like the S&P 500, crude oil has its own volatility measure. Right now the OVIX is at pretty high levels.
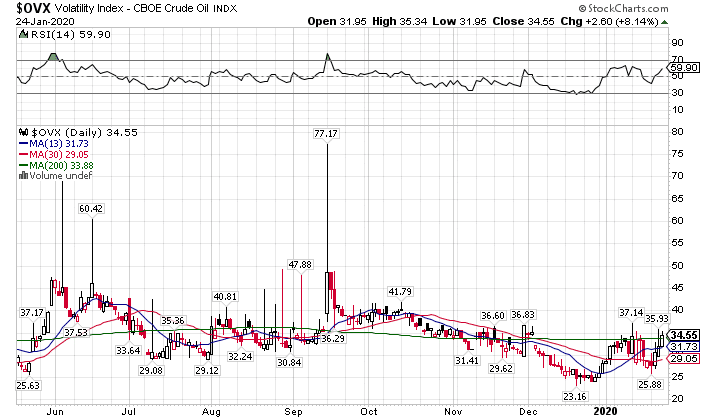
OVIX Daily Chart
That’s not to say that oil volatility is at record levels. Rather, it’s at relatively high levels. So it certainly can go lower. But, the OVIX is mean-reverting and is overextended in the short-term.
Betting Against China
Before the Coronavirus hit the wires, I already had an option bet against Chinese stocks. This paid me over 100%, and I still have part of the position.
You can learn how the same secrets to find trades like this.
