If I could give you one indicator to use for the rest of your life, it’s would be the 200-period moving average. I don’t think there’s any other indicator out there that gives you better insight into a stock or overall market.
It’s what I call my ‘Gravitational Line.’
Today, I want to explain how I use it to my advantage—from understanding trends to using it as a key level. More importantly, I’m going to share with you the most crucial aspect of making it work—context.
You see, many traders look at the 200-period moving average as an absolute indicator. They don’t realize that you have to step back and look at how the stock traded recently relative to the gravitational line.
Did the stock cross multiple times? How long has it been since the last touch? How far away is it?
All of these questions are essential to effectively using the 200-period moving average in your trading…
Gravitational Lines Calculations
Before we get to the fun part and how we can use the gravitational line as a trading tool, we’ll need to see how it’s actually calculated—don’t worry though, you don’t need to do any math whatsoever.
The 200-period moving average refers to the simple moving average. The calculations are pretty straightforward. You take the closing price for the last 200 periods and average them. This creates a point for that period. Connect the dots, and you get the 200-period simple moving average.
You can find them on most stock charting software as a standard indicator. They may be labeled as SMA for simple moving average.
When you pop it into a chart, it will look something like the green line in this SPY chart.
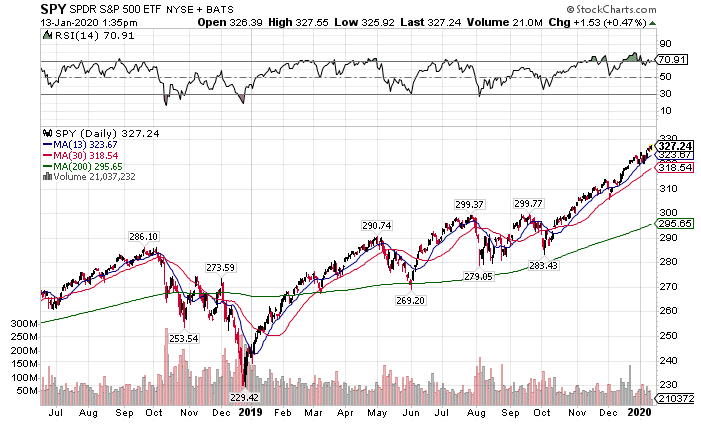
SPY Daily Chart
Traders like using the 200-period moving average as a guidepost. It takes a long time to turn around. Shorter time-frame moving averages like the 13-period moving average react quickly to price change. When you get sustained trends, you’ll start to seem them play out on the 200-period moving average over time.
Understanding Trends
The first step to identifying reversal patterns is to figure out the overriding trend. You want to find a setup where the long-term trend remains intact, but the stock makes a retracement within that framework.
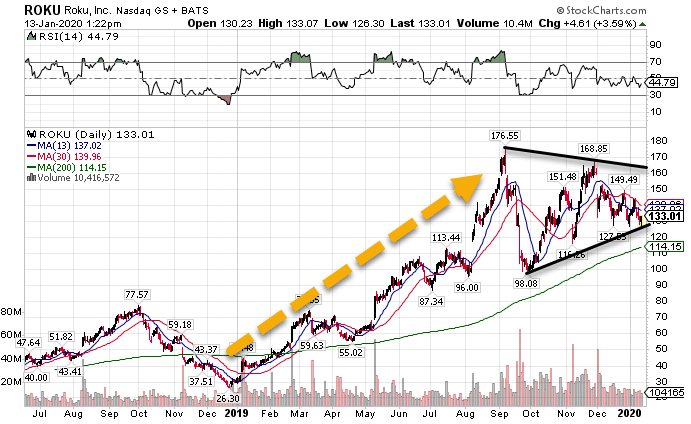
Here’s an example with ROKU.
ROKU Daily Chart
Even with the recent pullback, the stock remains in a bullish trend overall.
How can I tell? First, I look to the 200-period moving average on the daily chart. ROKU not only hasn’t hit it since the beginning of 2019 but remains solidly above that indicator. Many traders, not just myself, use the 200-period moving average as a line-in-the-sand for determining trends.
Now, the key is that the stock needs to be trading above the 200-period moving average consistently. Stocks that waffle back and forth, crossing it multiple times, aren’t necessarily bullish.
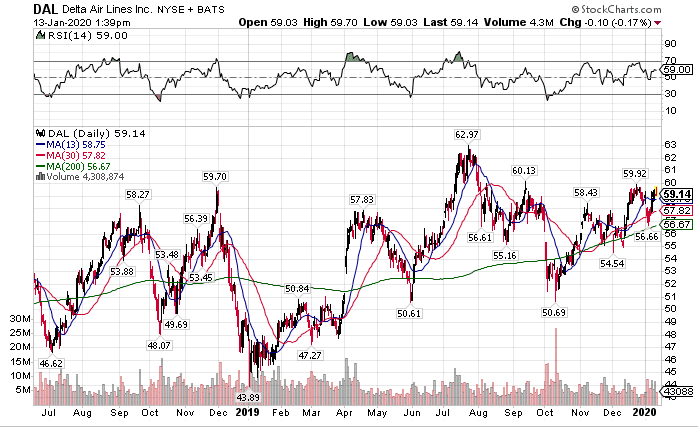
Check out the daily chart of Delta (DAL), and you will see what I mean.
DAL Daily Chart
Overall the stock looks more bullish than bearish. However, I wouldn’t say there is a clear, overriding bull trend here. Nor would I use the gravitational line to trade against. You can see how the stock crosses the line multiple times. This reduces its importance.
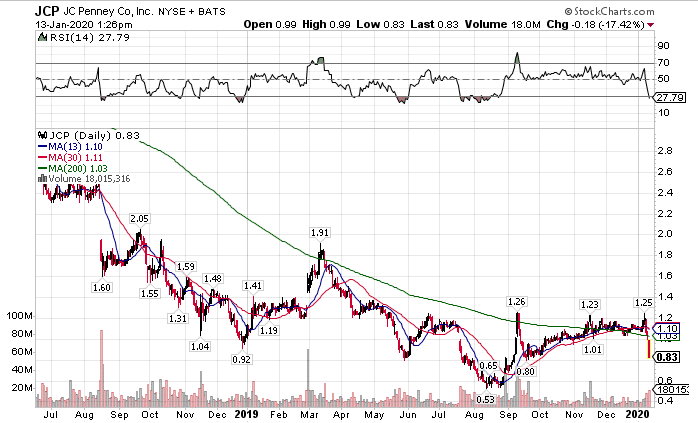
On the flip side, the gravitational line can become resistance. Stocks with protracted downtrends will often bounce off the 200-period moving average on spikes.
Check out how this plays out with JC Penny.
JCP Daily Chart
Selecting Your Time-Frame
The charts I’ve shown you so far are for daily periods. However, the gravitational line really works on any time-frame. The key is to understand how it lands in context to the larger trend.
For example, let’s use the ROKU daily chart from before. We had a clear, uptrend that’s still intact. However, let’s break it down to the hourly chart.
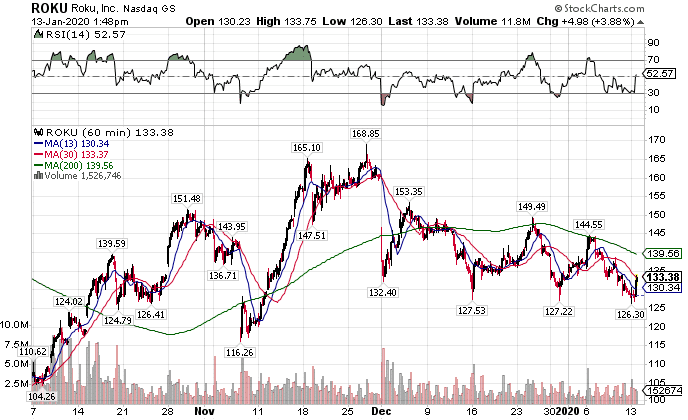
ROKU Hourly Chart
Right now, the stock is trading under the 200-period moving average and looks rather bearish. If I want to play short-term, I can be short against the 200-period moving average all the way down to the daily moving average at $114. However, down there, I would expect the longer-term gravitational line to outweigh the short-term one.
Ideally, I want both the long and short term trends to align. However, we don’t always get that lucky. The key is to avoid trading against the longer-term averages using short-term time-frames. Otherwise, you run the risk of the trade reversing in your face.
The Right Amount of Time Since It Touched
I’ll share a little secret with you. Ideally, I want the stock not to have touched the gravitational line for about 25-30 periods of whatever time-frame I’m looking at. The longer it’s been since the touch, the more likely the gravitational line becomes a trade level.
That doesn’t mean it works every time. But trading is about probabilities. Create the right conditions, and you’ll generate more wins than losses.
This Is How I Identify My Bullseye Trades
Many of my Bullseye Trades use this exact method as an entry, a stop out, or a target. These are trades I aim to get a +100% return each week. So with one trade idea for the week, I want to make these the best ones possible.
