Brace yourself, earnings season is upon us—and I can’t wait.
Financial institutions are first on tap, so let’s begin this week’s Intermarket Analysis with the bond market.
Bond’s Ready To Break Out?
Since the bond market peaked back in August, bonds have been trading in a downward, narrowing price channel.
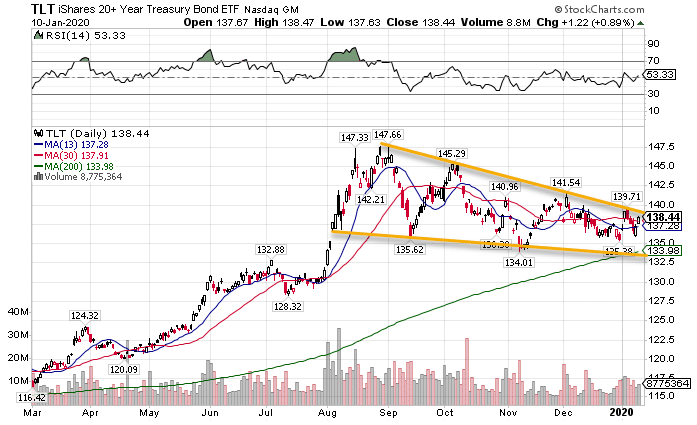
TLT Daily Chart
It appears that time may be running out. The channel should collapse within the next month at the same time as the 200-period moving average reaches the price.
When I see these two factors coming together, and price still in a long-term uptrend, I think bonds may be signaling another break higher.
That would be an incredible feat. But, it could spell doom for the stock market.
Are stocks Ready To Roll Over?
They say it’s hard to kill a bull. This market proves that is certainly the case. Since October the market climbed nearly every day, other than a short pullback to end November.
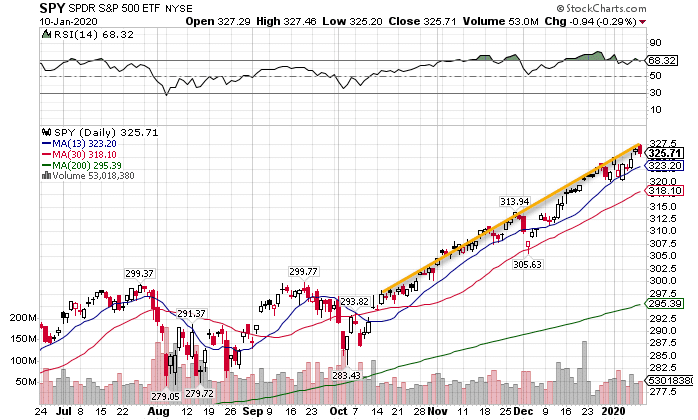
SPY Daily Chart
The moving averages remain the same distance from one another, if not widening a touch. Yet, this move is beginning to get into the unsustainable category.
I reckon that if bank earnings, don’t stir the pot, the next set afterward will. Banks rely heavily on the spread between the short-term and long-term bond yields.
This creates their profit margin known as ‘net-interest margin.’ With bond prices up, yields go down. While there is still a spread, it generally gets smaller the higher bond prices go.
That makes the bank outlooks interesting given that they should expect low-rates for the foreseeable future.
Gold’s Run Isn’t Done
At first, I thought that the pop-off in gold might have been a top. We saw prices spike overnight on the U.S.-Iranian conflict before they came off sharply the next day.
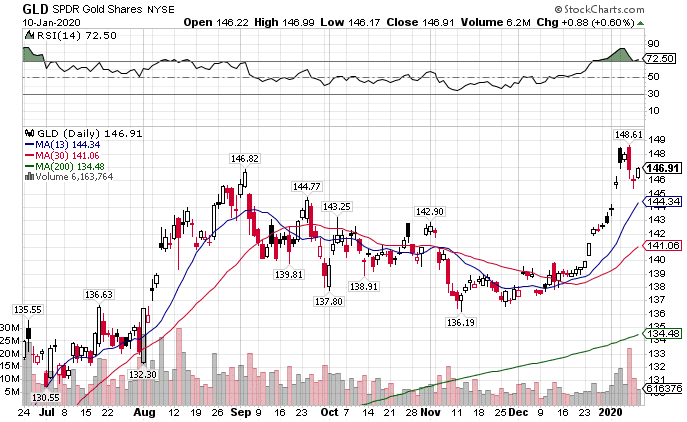
GLD Daily Chart
Recent price action suggests to me that gold is instead resuming its previous breakout. When you flip to the monthly chart for the yellow metal, you’ll see what I’m talking about.
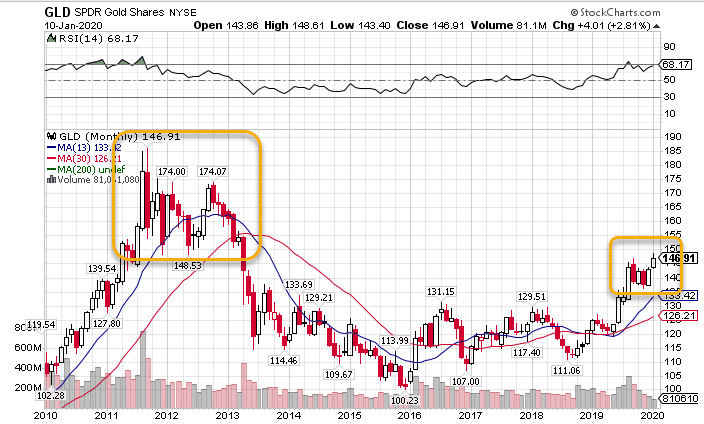
GLD Monthly Chart
Gold’s monthly candle has started to break out above the previous consolidation. That leaves it a lot of runway to move up towards the old highs put in almost a decade ago, nearly 30% higher from where we are now.
It’s also likely we see silver make its run with gold, though not as far.
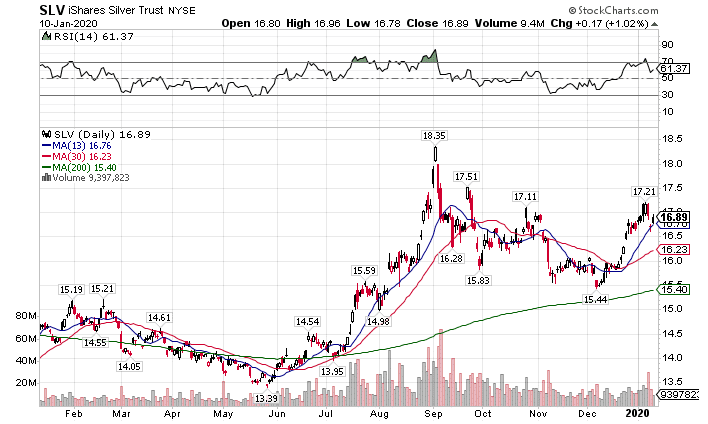
SLV Daily Chart
Silver isn’t anywhere near the old highs from a decade ago, nor the recent highs. However, the moving averages all turned higher, and I think this could test the recent highs up at $18.35 without much of a problem.
Will The Dollar Make A Comeback?
Up until September, the dollar had been on an absolute tear. It looked like it was going to hit par ($100 on the dollar index). However, it’s backed off a good way and the question is – will it bust through?
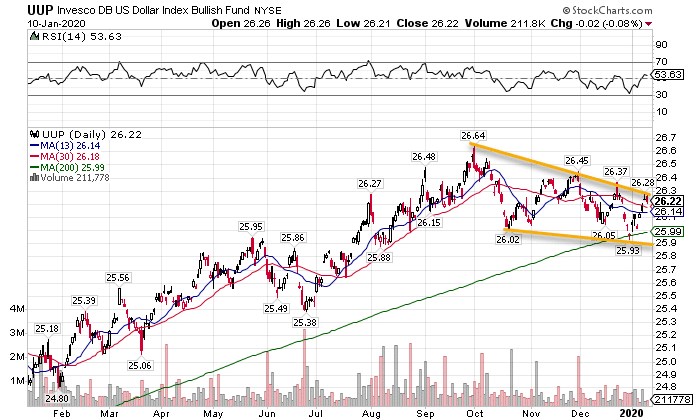
UUP Daily Chart
The dollar has a similar look to bonds, without the tightening channel. It’s already found support off the 200-period moving average once. Yet, until it breaks out one way or the other, we won’t know where it wants to go.
Crude Oil Ready To Rally Again
When news of the U.S.-Iranian conflict hit the wire, oil prices shot through the roof. But, like gold, they pulled back shortly thereafter. Now, they’re set up again to make another run.
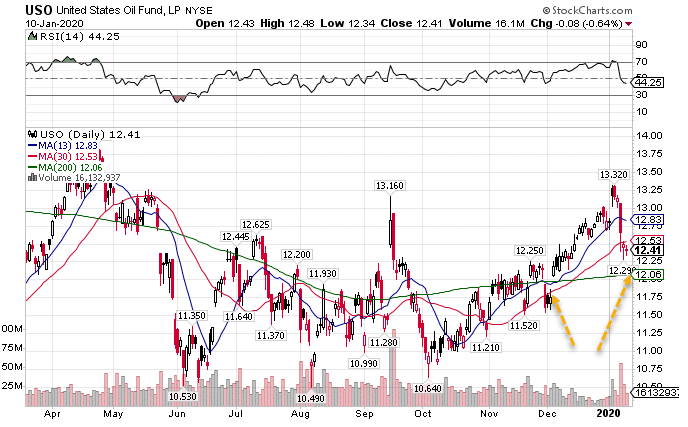
USO Daily Chart
I’ve got my eye on two places for support. The first would be the 200-period moving average on the daily chart. That moving average tends to remain important across all charts and time-frames.
The second would be a gap fill from the rally in December. I wouldn’t mind that area, as that would bring down the oil and drilling stocks (XOP) to a sweet retracement level to buy.
The VIX Says Not So Fast
Friday was a bit of a nail-biter for the VIX. I wasn’t sure whether it would close into the range of the previous day.

VIX Daily Chart
The index closed a full two pennies above the previous day’s close. It is enough to keep things interesting. That’s why I wanted to look at the VVIX for additional clues.
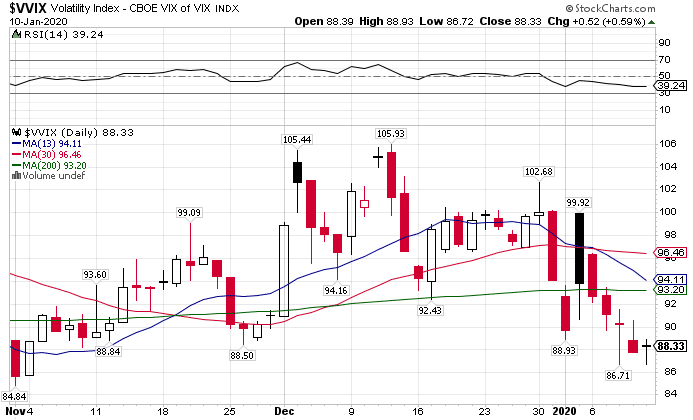
VVIX Daily Chart
So much for any help here. When I compare these two charts and the SPY chart, I don’t get anything that says the market rally will be derailed. But, things certainly have a toppy look to them.
The Best Play For the Week
When in doubt… sit it out. But for those that want to trade the day away, we’ve got Total Alpha to suit your needs.
So grab your coffee because the day starts early, with trades coming at your first thing.
