Tired?
That’s what many traders thought when describing this 11-year bull market run. And with geopolitical tensions rising, it felt on Friday we might see it breakdown.
Not only have stocks been able to shake-off the headlines—we’re back to all-time highs.
And you know what?
I positioned myself to capture gains no matter which way the market went. It just so happened this recent push higher helped me capture a gain of over $32,000 this past week in Total Alpha.
![]()
Although the trade was doing quite nicely beforehand!
But now we have to ask – where does that leave us?
A look back in time
From the end of December 2017, markets ran four straight weeks higher, closing each week near the highs, and finishing up 7.5%, and 20 points on the SPY. The SPY then nosedived as much as 11.76% over two weeks before closing down 8.77%.
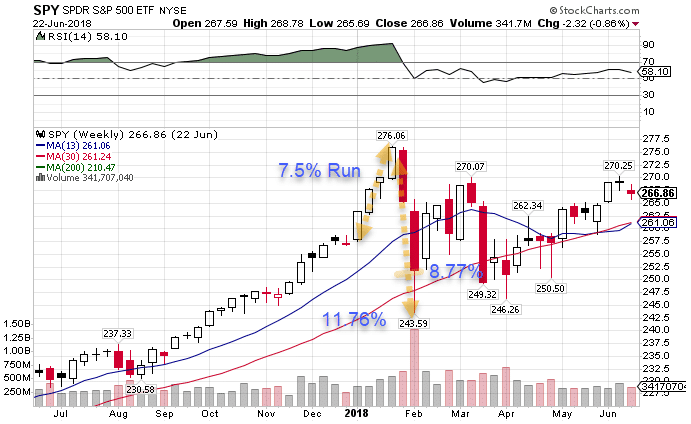
SPY weekly chart
Right now we’re only up 0.62% and about 2 points on the SPY. Using the closing print of $322.41 on January 3rd, a 7.5% run would put us up at $346.59. If we saw the same decline from that point, the SPY would fall to a low of $305.83 before closing at $316.19.
That doesn’t seem that bad from where we are now. But trust me, it feels like the end of the world at the time.
2018 isn’t that different from what we should see this year. That was another election cycle, albeit a smaller one. Plus, economic data improved markedly, which follows current expectations. The only downside was the market reaction to the Fed raising rates in December which created a panic.
A potential reversal in gold
For the past few weeks, we’ve seen gold march higher, even as stocks kept making new highs. Overnight gold futures spiked hard on the news of the Iranian attack. However, gold took the opposite road as the markets, doing a faceplant into the dirt.
What caught my eye was the weekly candle forming on gold futures.
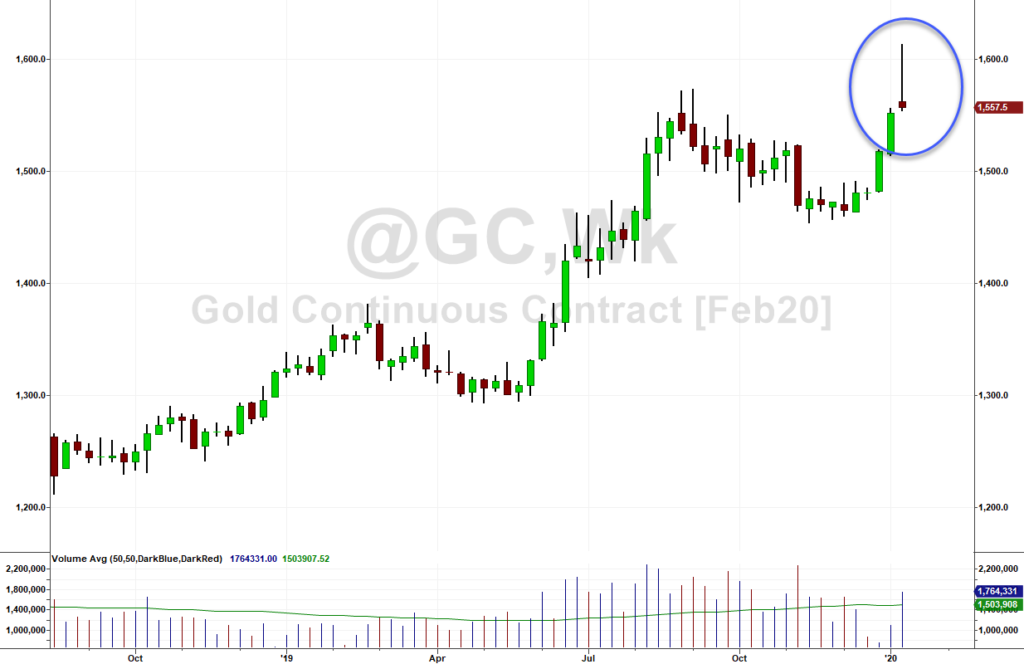
Gold Futures Weekly Chart
This is a pretty significant development. If gold closes out the week down at this level, it could mark a stark reversal in the yellow metal. That’s in contrast to the obvious bull-run that led the last few weeks.
Crude got the smackdown
The slow grind higher in crude futures hit a brick wall in a similar manner to gold. However, a correction in the commodity was long overdue…and I don’t think the bull run is over.
Here’s what I’m looking at.
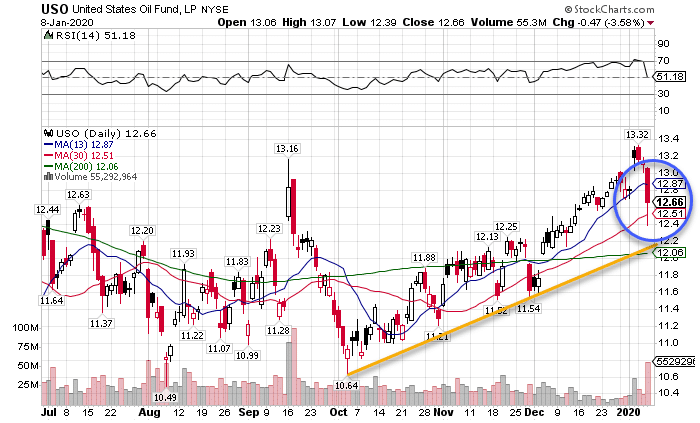
USO daily chart
First, I saw crude oil run down to and bounce off the 30-period moving average. That’s a positive sign for crude oil. I like to see charts hold the moving average. In this case, the 30-period moving average has held for several months.
However, even if that were to fail, there’s a nice trendline underneath that connects the lows of the candles. That comes right in near the 200-period moving average, which also provides support.
That’s why I like the oil and gas drilling sector (XOP).
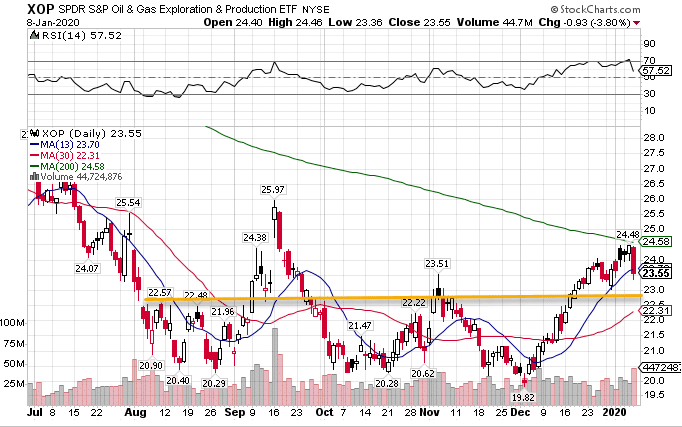
XOP daily chart
I do want to see a pullback, possibly all the way to the 30-period moving average. That would set this up nicely to make a run back up to the 200-period moving average and possibly beyond.
Bonds don’t look as bad as you might expect
Normally, bonds sell off when stocks rise. That certainly was the case yesterday. However, it wasn’t the tragedy that we typically see.
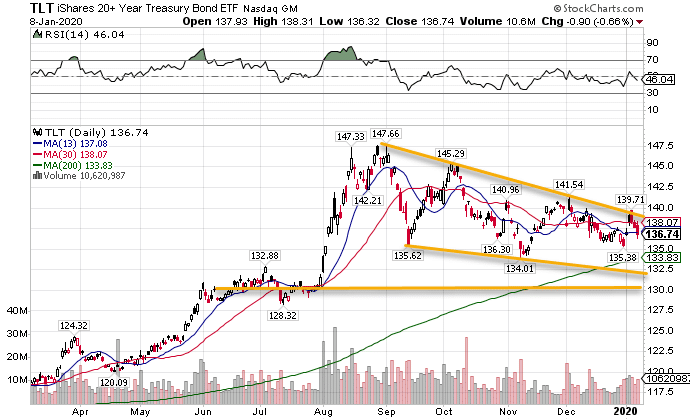
TLT daily chart
The upper trendline that connects the highs of the swing points held once again, leading to a multi-day selloff in bonds. It certainly looks like they will head lower to at least the 200-period moving average.
Right now I’m eying the $130 area. It’s a nice round number that also lines up with an area of consolidation. That would be the ideal spot where I would expect to see support.
An interesting end to the VIX
At the end of the day markets gave up a bit of their gains. That happens from time to time. What I thought more important was how that translated to the VIX and VVIX.
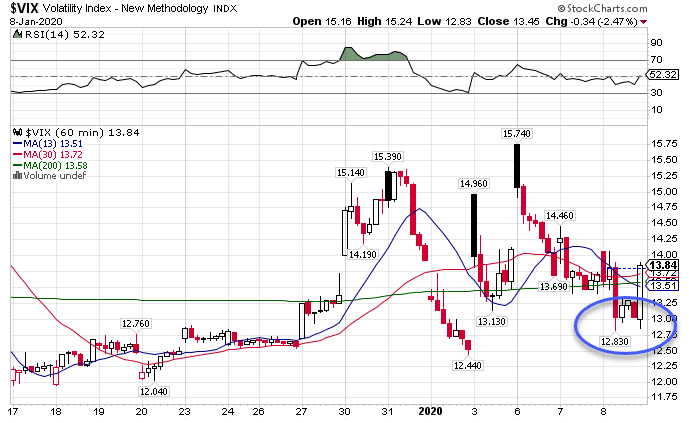
VIX Hourly Chart
The VIX itself made a double bottom and then took off back to the northside. That’s a bit more aggressive than the move we saw from stocks at the end of the day.
Similarly, the VVIX made a double bottom and made a stark reversal to finish down less than 1%.
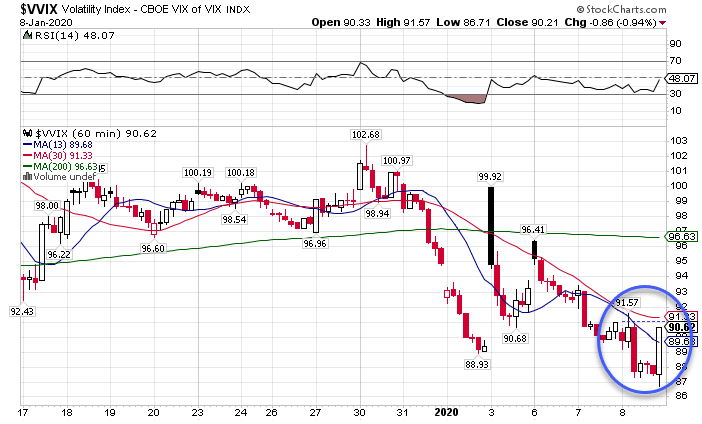
VVIX Hourly Chart
This could just be an anomaly. However, I think this plays out in the next couple of days. While we got a relief rally, these indicate that markets might want to pull back off this recent run.
So where does that leave us?
Still at the mercy of the Federal Reserve. As long as they keep expanding their balance sheet, stocks are free to move higher. That doesn’t mean we won’t see pullbacks along the way…and I’m certainly bulletproofing my portfolio.
I want to create a consistent stream of income from my Total Alpha Portfolio. That’s why I’m incorporating new trade ideas and strategies that let me ride the run and manage my risk.
You can learn these exact same tactics and trade today.
Click here to join Total Alpha.
