Volatility is BACK.
All you had to do is look at the Dow futures last night, which were down 400 points—only to see them trading flat this morning.
While most of the talking heads spent the first week of 2020 comparing it to 2018, and how this market was destined to go higher—politicians had another agenda.

So when the news of a potential conflict with Iran hit the news wire, I was prepared.
No… I don’t have any connections in Washington tipping me off.
I didn’t need to.
Instead, I maintained a balanced portfolio consisting of long and short positions.
Sure, I have a bias but I let my indicators and favorite patterns dictate where I put my money in.
But being balanced is just one way to navigate through a volatile market.
Being selective and finding low risk and high-reward setups is another recipe for success in this market.
As well as, taking advantage of opportunities specific to the current turmoil.
Why?
Because the market hasn’t priced in the real possibility of war.
If that happens, investors could find their portfolios upside down.
I don’t want that to be you. That’s why sharing my gameplan for trading a choppy, news-driven, and politically intensified market.
Managing a series of long and short positions
This year I plan to maintain a more neutral portfolio, where I carry long positions in some stocks, and short positions in others. Traders refer to this as ‘Delta’ neutral, where delta refers to the amount an option’s price will change per $1 movement in the underlying stock.
You can read more about delta and delta neutrality in my free article here.
The question I got after writing this article was which stocks do I choose to go short and which do I go long?
I select the stocks based on their individual charts and other qualitative information. For example, I’m usually bearish on Netflix ever since they reported poor earnings. Traders continue to sell into every resistance.
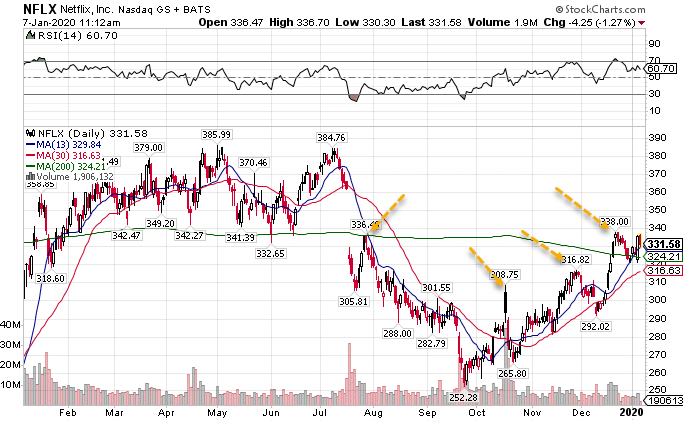
NFLX daily
The orange arrows note where the stock ran into resistance in several spots along the way. Each of these areas ran into resistance for different reasons. Here’s a few different ways that you can look for resistance areas:
- Previous swing highs and lows
- Fibonacci retracements
- Moving averages (especially the 200-period simple moving average)
- Consolidation areas
- Gaps
These also work for finding support areas.
However, the most important component – trend. I always look at the longer-term trend for the chart. Most of the time, this dictates whether I’m short or long a stock.
Now, I also use a set of secondary factors to select the stock. These includes:
- Liquidity (trade volume)
- Sector
- Options available
- Relative strength
Ideally, I want a balance of trades across different sectors and stocks, unless I have a specific reason not to. That creates diversity in the trades and minimizes volatility in your returns.
Profiting from the Middle East Conflict
We’ve already seen crude oil prices take off on the news of the U.S. strike. However, crude had already been building a nice uptrend for the past few months.
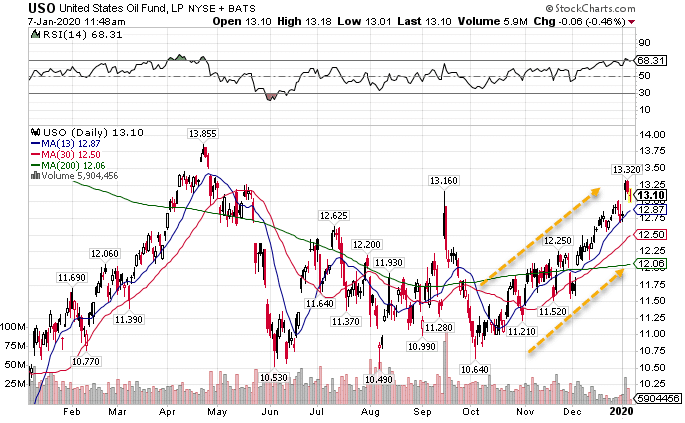
USO daily chart
Most professional traders trade crude oil futures. However, I prefer to work with liquid ETFs like the USO. These ETFs offer me the flexibility of options and require less capital than futures contracts.
I also like to play stocks that benefit directly from a rise in crude oil prices. This includes oil and gas exploration companies and drillers. The XOP ETF works really well as a trading vehicle here.
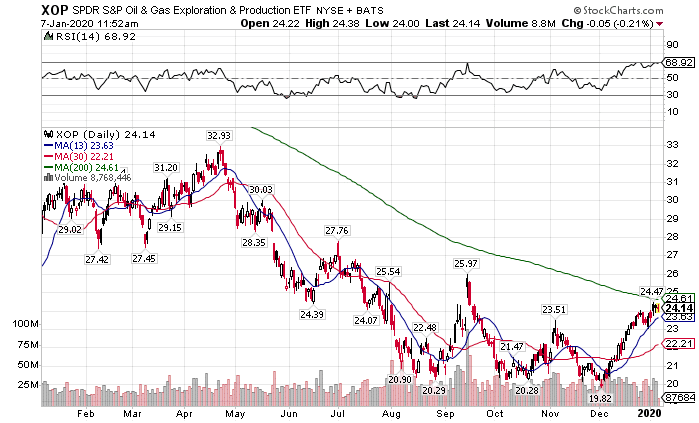
XOP daily chart
This ETF already ran 20% since the lows in December. Picking individual companies can be tricky. With tightening lending from U.S. banks, we could see a wave of companies go under. That’s why I prefer to use the XOP as a basket trade.
The other beneficiary from global conflict is gold. Investors love to stash their cash in gold as a ‘safety trade.’ Additionally, gold tends to rise when traders expect future inflation since gold is priced in dollars. With the Fed flooding the markets with easy money, this is another tailwind.
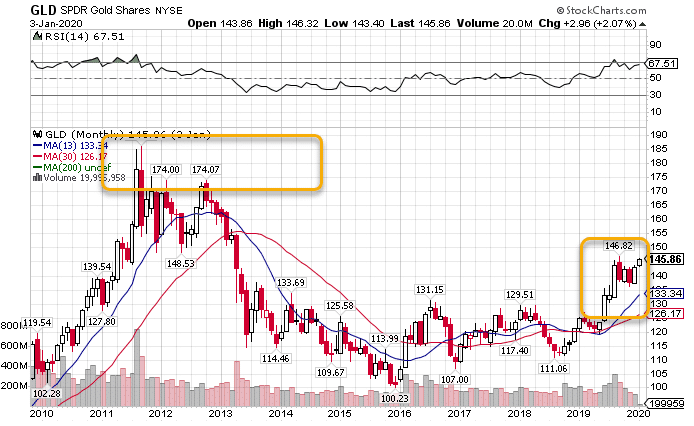
GLD monthly chart
You can see how Gold (through the GLD ETF) is breaking out of its consolidation pattern. That leaves a lot of runway to make its way towards the all-time highs set back in the early part of the decade.
The last option I like is defense companies like Lockheed Martin (LMT), Raytheon (RTN), Honeywell (HON), and others. If we enter into a prolonged conflict, these companies stand to benefit from any increase in government defense spending.
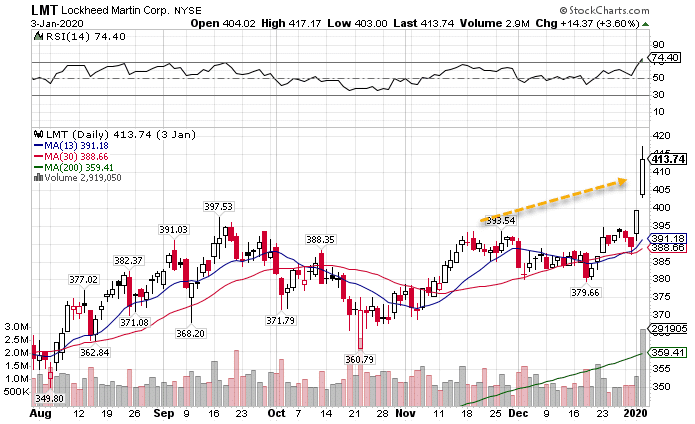
LMT daily chart
You can see how Lockheed Martin already spiked on the first event. Large scale events certainly benefit the company’s bottom line.
Incorporating this into my 2020 plan
My goal for 2020 is to create more consistent, dependable payouts from my trades. That involves a lot more market neutral strategies.
I’ll be diving into this each week with Total Alpha Members, showing them strategies that backtested an over 90% win-rate.
You can join the action by becoming a member of Total Alpha.
