Hello Trader,
With only two trading days remaining in the year—let’s cut to the chase…
When I survey the different markets I see omens that portend a dark future – each playing like a tarot card of possibilities.

Let me shine a little light on things for you
While technology may be finishing its race, the energy markets look like they may just be heating up. There’s also a sweet trade I see amongst the rubble.
The End of The Road For Tech
Gravity eventually grabs hold of everything. What goes up must come down. Technology-led this rally, but it won’t sustain it.
Companies like Apple (APPL) rallied hard this year, nearly doubling in value.
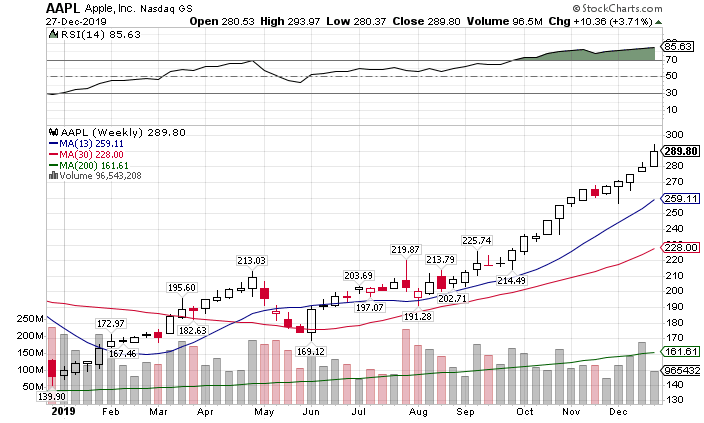
AAPL weekly chart
Stocks can’t sustain this kind of move without meaningful growth or changes in the economic landscape. Considering overall S&P earnings were up less than 3% when you strip out energy, I’d say the stock is overcooked.
The broader Nasdaq 100 (QQQ) rallied nearly 40% this year. While it’s not the hieght of insanity we saw in 1999, it’s not far off either.
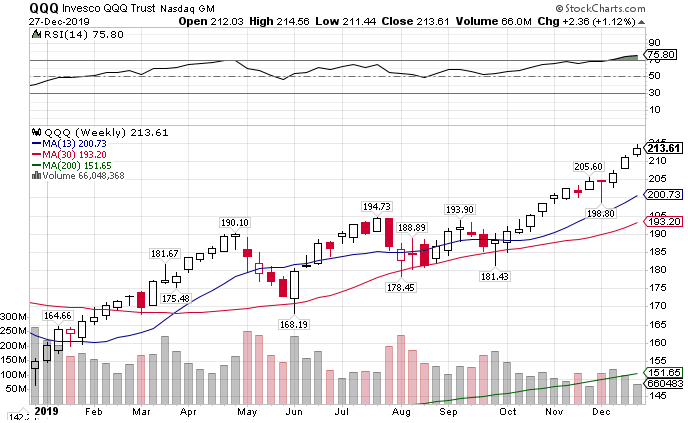
QQQ weekly chart
And let’s not forget the commoditized semiconductor sector that’s subject to the whims of supply and demand. It’s up a healthy +64% this year.
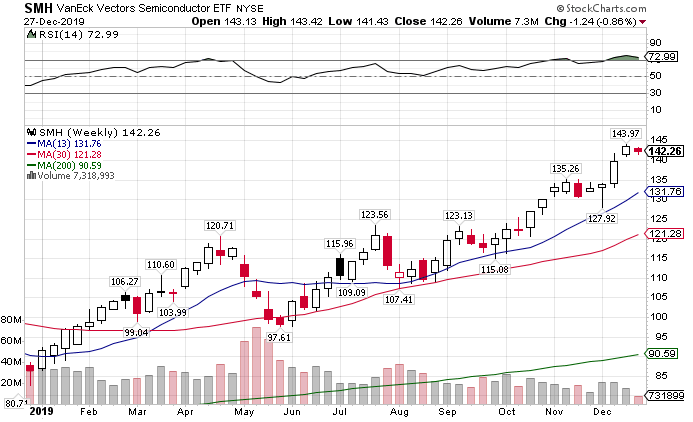
SMH weekly chart
Do we blame the Fed for this?
In part. But that would be underselling the lousiness of the rest of the world. The U.S. simply is the best market in the dumpster fire of global growth. That’s led to not just stocks but bonds to rally as well.
At its height, the TLT gained over 23% on the year. Although it gave up 10% since then, U.S. Treasuries remain the smartest student in a classroom of failures.
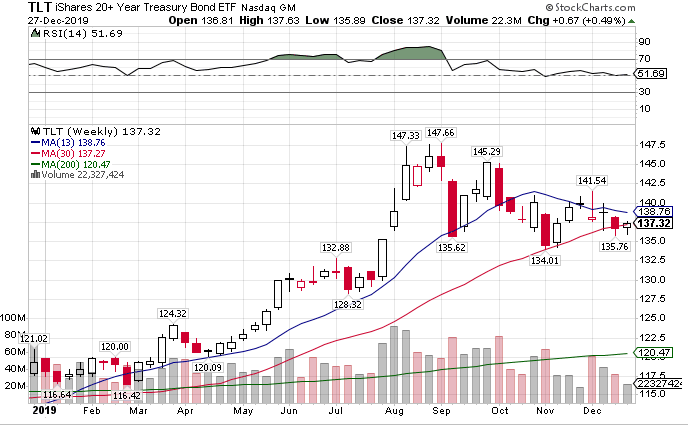
TLT weekly chart
This is one market I don’t believe is done yet. Long-term, unless the Fed starts raising rates or cutting back on its balance sheet, I expect U.S. bonds to benefit from any and all equity pullbacks.
And don’t count out our friend gold, the safety trade since the invention of the wheel. Despite outflows in Q4, the last week saw a massive influx of interest.
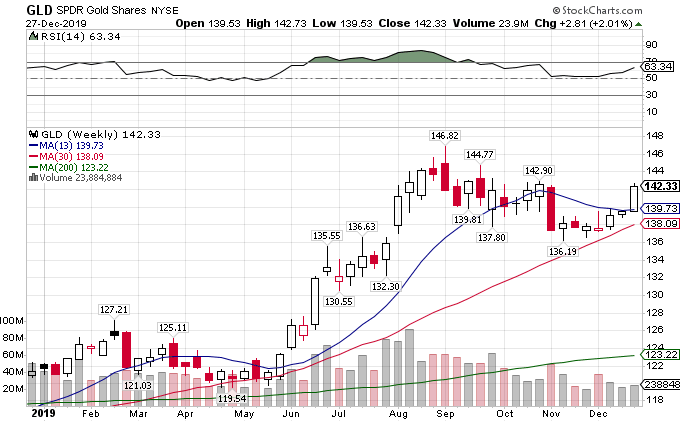
GLD weekly chart
No matter the politics or outlook of stocks, I think gold is setting up for a multi-month and possibly multi-year run. Price should challenge the bubble high that was set back in 2011, an almost 30% increase from here.
The emerging-market catchup trade
There’s been a lot of jawboning lately about emerging markets picking up some steam. Places like Brazil, India, and China may be setting up for a bull run if the global economy is reflating.
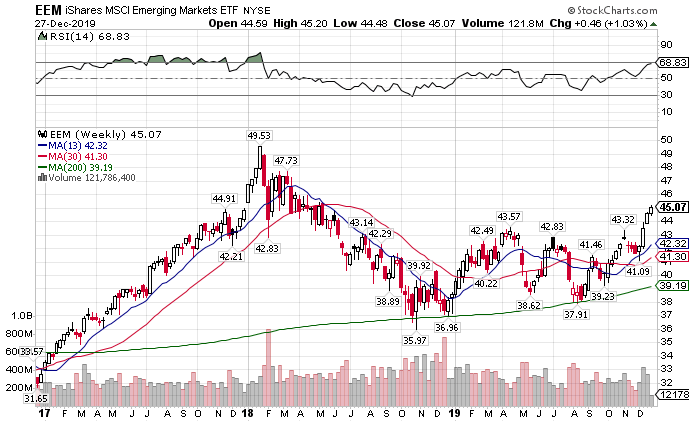
EEM weekly chart
I wouldn’t be a buyer here. The trade itself doesn’t have much gas left in the tank. Instead, I’d rather pick out individual equities, sectors, or countries to ride this run. For example, the Brazilian market (EWZ) looks more appealing.
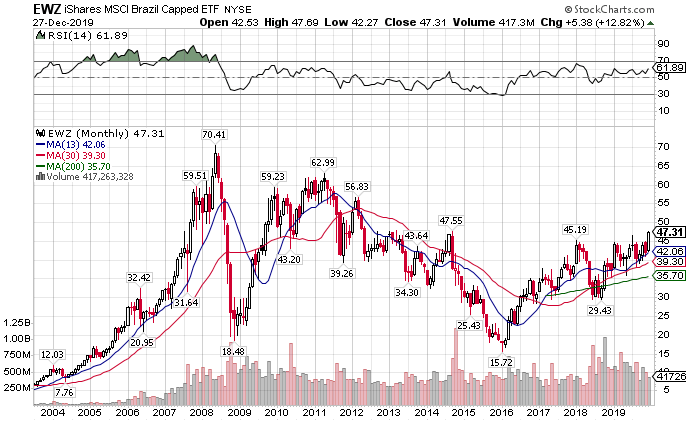
EWZ monthly chart
Small caps still have room to run
Compare the charts of the S&P 500 ETF (SPY) vs the Russell 2000 ETF (IWM).
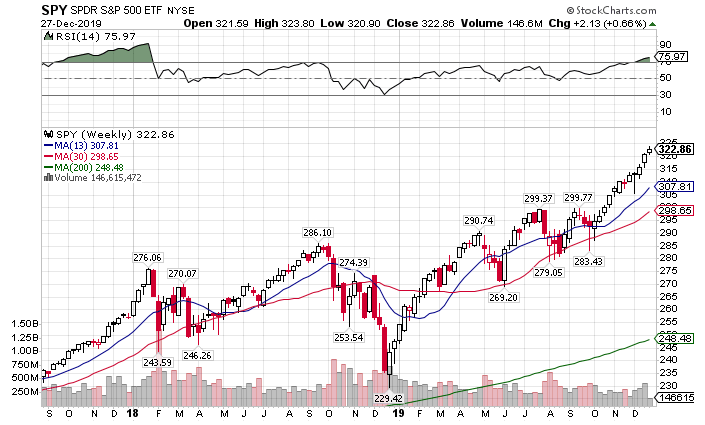
SPY weekly chart
Much like the QQQ, the SPY chart looks severly extended and due for a correction. However, the IWM chart looks much healthier.
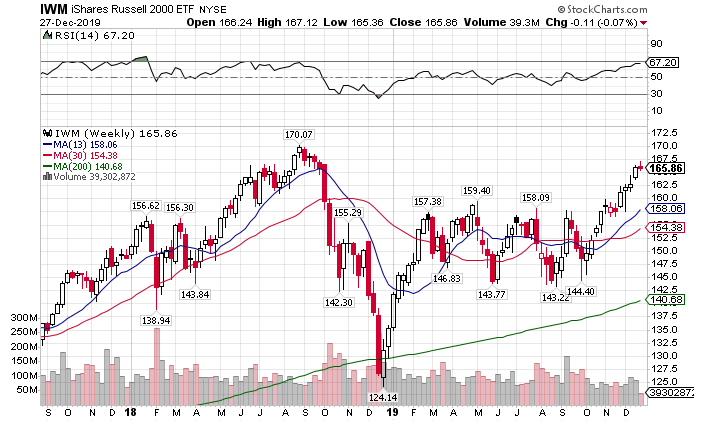
IWM weekly chart
Not only does it have room to take out the old highs, but the RSI isn’t nearly as overbought as the other markets.
When I want to reduce my positive delta (long) exposure I would bet against the SPY. Conversely, if I wanted to increase my positive delta exposure, I would sell put spreads or buy calls on the IWM.
The biggest sweet treat to meet
Lately, I’ve been watching the rise in the oil and gas exploration ETF, XOP.
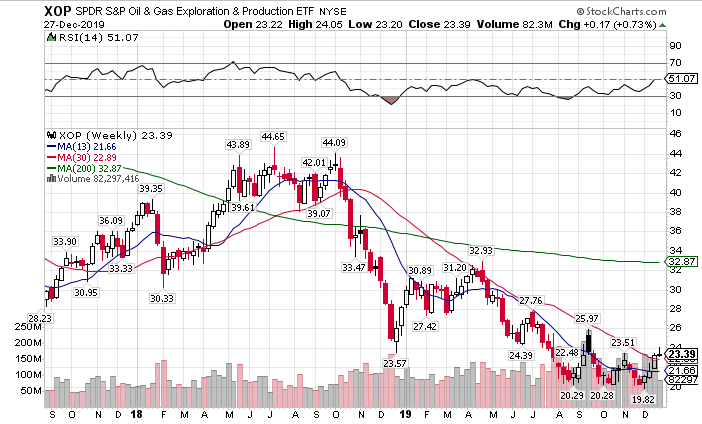
XOP weekly chart
What’s caught my eye here is the 30-period moving average. Price finally recaptured this level. The last time it traded above was before the crash at the end of 2018.
This indicates a really bullish sign. That could mean a quick run up to at least $30-$32, and potentially higher. Of all the sectors, the XOP has the most potential to become a multi-month trade that continues to pay out.
And within that bad boy is a nice speculative play with the Natural Gas ETF UNG.
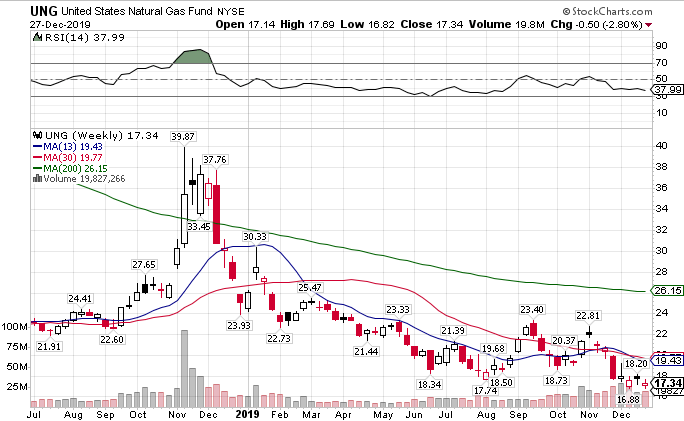
UNG weekly chart
This ETF doesn’t track Natural Gas well. It has a natural erosion that makes me not want to own it long-term. Plus, the current implied volatility is extremely high.
However, that makes it a good candidate to sell put spreads into. That lets me collect on IV reductions as well as huge rips that have become common in natural gas prices. This could set up to be one of my favorite areas to trade in Q1.
What’s the one stock I think outdoes them all in Q1?
I’m getting ready to release my best ideas for the quarter to Total Alpha members. These are my handpicked stocks that don’t just deliver one or two trades, but streams of trades through the next 90 days.
But you can only get those with a Total Alpha membership.
