It seems like every day that passes, stocks just keep climbing higher.
With the S&P 500 up more than 5% since November—nearly every analyst on the Street is now bullish.
Is this party going to continue into 2020 or is it time to start laying down some shorts?
Take a page from the Total Alpha zen master…

… Make a list of bullish and bearish signals you see out there…
Lay it all out there and then listen to what it says. It won’t take you long to find your ‘Eureka’ moment.
I want to walk you through several areas that stood out this week you might have missed. Equities may be hitting new highs, but the VIX looks ready to bounce hard.
A bottom in the VIX?
The end of the year can cause things to go a little haywire. Typical correlations break down as funds rebalance and try to dress up their performance.
But the VIX rarely lies. We usually see the VIX fall when equities rise, and visa versa. So, it’s no surprise to see the VIX well below its historical averages.
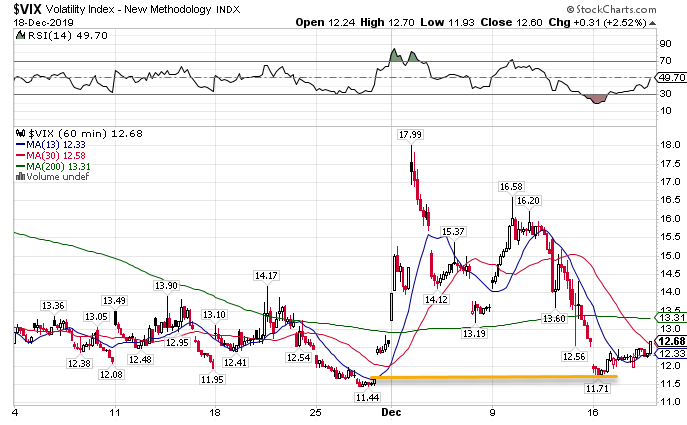
VIX hourly chart
Once the VIX closed in the price window, it found support at the old swing lows. It’s slowly tiptoed up, even as equities hang out near the highs.
The VIX can stay at extreme lows for much longer than you might realize. But, it still gets pops off these levels. It may only reach $13-$14. But, that’s enough to catch some quick VIX trades if you know how.
Learn the best ways to trade the VIX with this free article.
However, the VVIX, which measures volatility on the VIX, hasn’t retrenched. In fact, it’s up comfortably at levels akin to August.
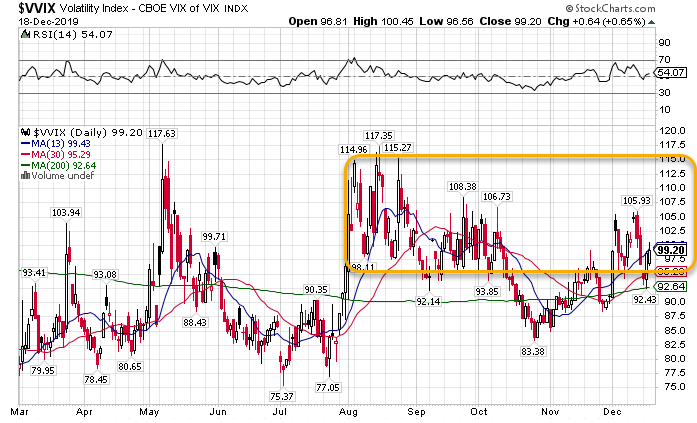
VVIX daily chart
Usually, the VVIX provides a reliable precursor to broader market moves. However, this could just be an indication of people buying protection against their long positions by purchasing call options on the VIX itself.
Energy Finding Its Rhythm
About a month ago, the OPEC leaders met with a few non-OPEC members and agreed to keep a lid on oil production for the foreseeable future. As China’s data slowly improved, crude oil marched steadily higher this entire month.
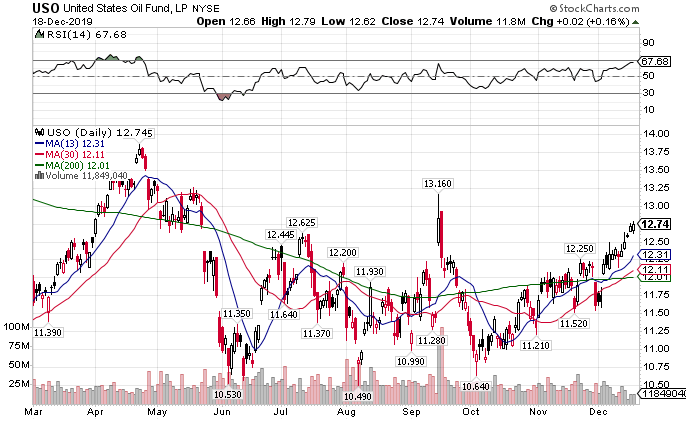
USO daily chart
I noticed earlier how both crude and equities appear connected at the moment. While it wouldn’t explain much of the move in the QQQ, the S&P 500 contains plenty of energy names.
Just look at the picture painted by the XLE (Energy ETF) and XOP (Energy Exploration ETF).
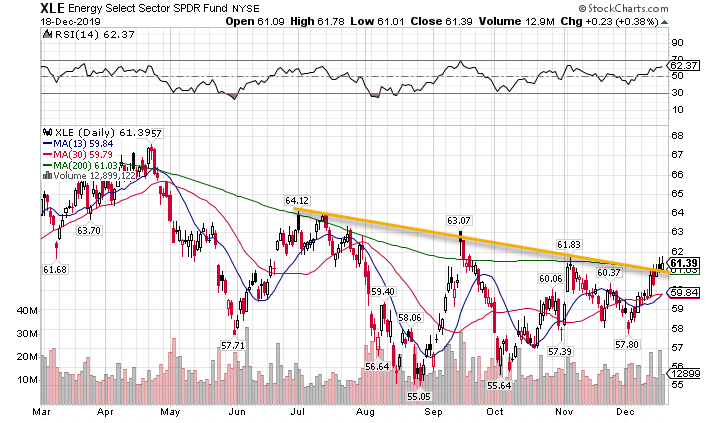
XLE daily chart
Unsurprisingly, it mirrors the crude oil chart. The recent consolidation catches my eye. Every other touch of the trendline caused an immediate reversal. Not this time. Price keeps floating around up here, just like the major indices. That could lead to a massive bull run in energy companies.
The real opportunity could be in the beaten-down exploration companies. Compare the decline in the XOP to the XLE.
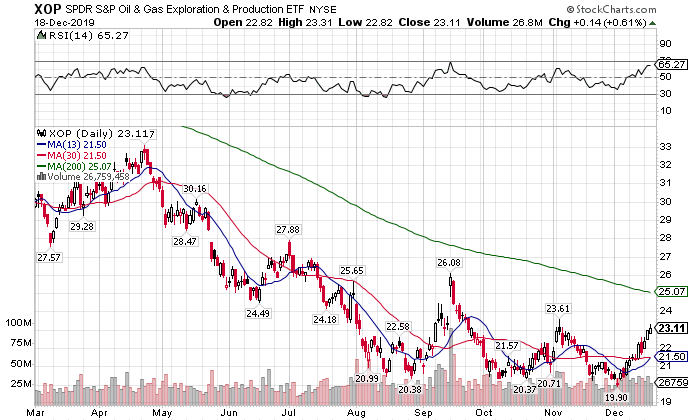
XOP daily chart
You want to talk about potential, the last time crude was at $60 a barrel (which is less than $5 away), the XOP was up near $32. That’s 50% from where we are today. The timing might be tricky. But this could produce some juicy gains.
Momentum Stocks Back in Vogue?
A lot of the IPOs and momentum stocks got hammered this year. Yet now it looks like traders want to pile back into these names.
Naysayers of Tesla found out the hard way not to bet against Elon.
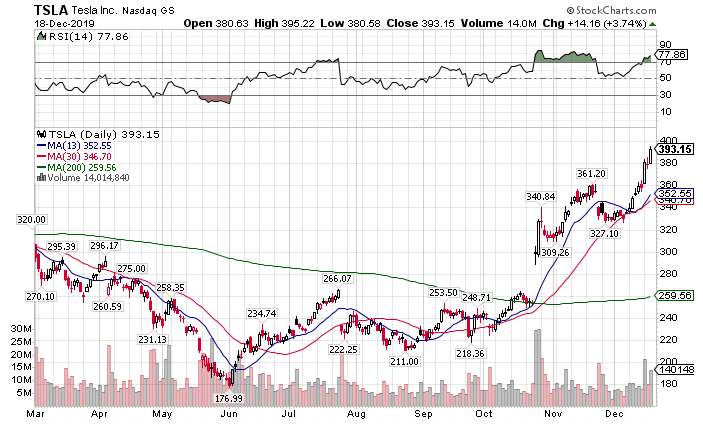
TSLA daily chart
This stock has almost doubled since October. I see no reason it won’t hit $400. There’s still a 20% short float in the stock, which could propel it further.
Speaking of short float, I love the action I’m seeing in Peloton lately. This stock has a whopping 60% short float. That’s almost ludicrous.
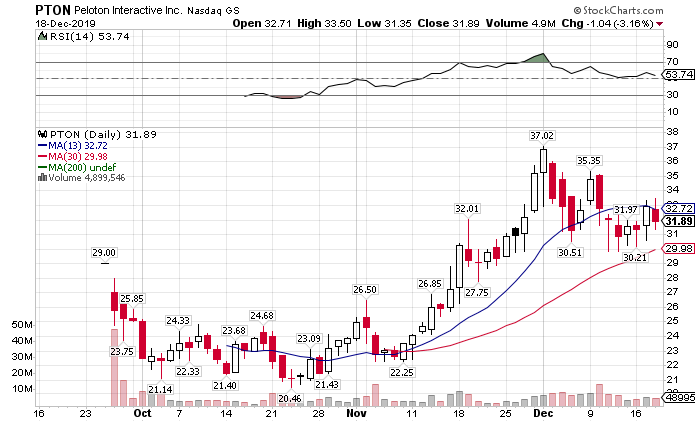
PTON daily chart
Nathan Bear’s started loading up the truck in Weekly Money Multiplier, and I’m not far behind. Beyond Meat thrashed short-sellers when it nearly doubled in price. I think we have a similar setup here.
Luckin Coffee is another IPO with absurd short interest at nearly 50%. Ben Sturgill’s riding this train in his IPO Payday because he sees the same thing I do.
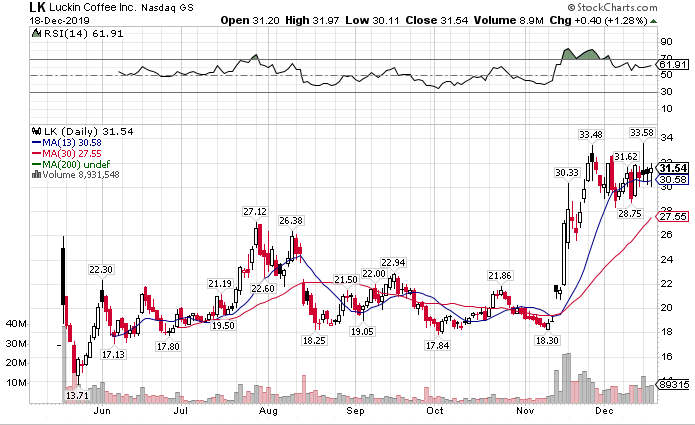
LK daily chart
If you ever read a chart pattern book, then you can easily identify the bull flag setup here. I mean this thing has the potential to double from here with the right squeeze.
The best spot I see to make the juiciest return…
That’s something you’ll have to join Total Alpha to find out. Can’t give everything away for free.
