The day came and went without the Fed delivering any surprises. Yet, markets threw up some puzzling, and quite possibly, confusing signals.
Bonds, gold, and stocks all finished higher—something few traders expected.
Not to worry, I’m here to make sense of it all for you.
The SPY, QQQ, IWM, and DIA have traded in a narrow range for four days…and just a stone’s throw from recent highs.
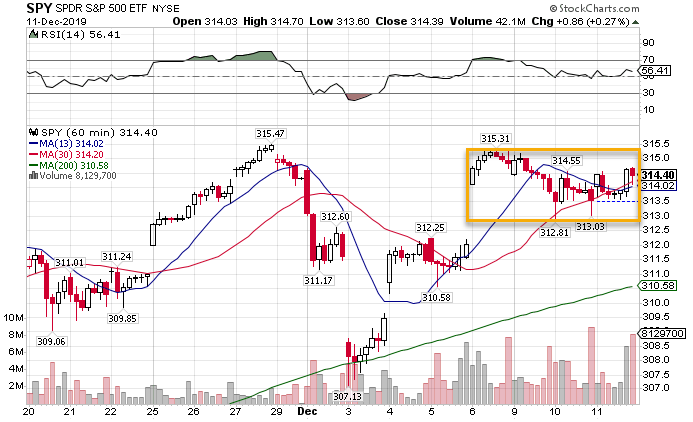
SPY hourly chart
The more equities trade up at these levels, the more likely they power through to new highs. That’s pretty bold considering the lack of trade tailwinds and an S&P 500 P/E ratio of 23.54.
Much of the market expansion this year came from easy Fed money. We’ve actually seen year over year declines in 3rd quarter earnings. 4th quarter isn’t shaping up to be much better.
But Jerome Powell reaffirmed the Fed’s commitment to low rates through 2021, even as market data suggests an improving economy. Markets always look to the future, and could easily ignore any present problems.
We need to dig into the VIX and VVIX to get the real scoop. The VIX finished down on the day over 4%.
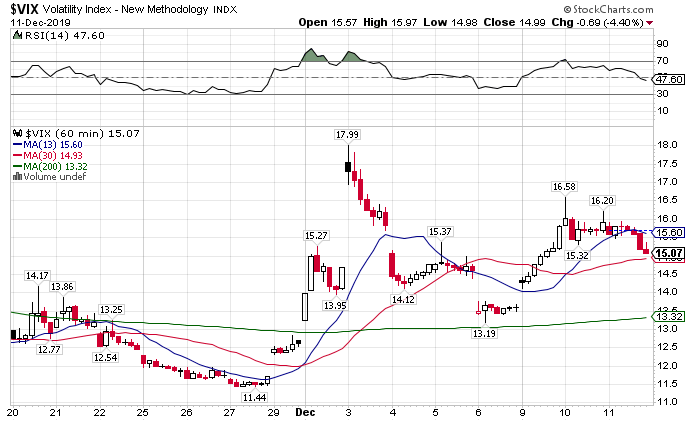
VIX hourly
Typically, you’d expect equities to be much higher with that kind of move. However, a lot of people bought protection against the Fed announcement. So it’s not really a surprise to see some of the air let out of the index.
Except – the VVIX told a completely different story, finishing up 3.75% in the day.
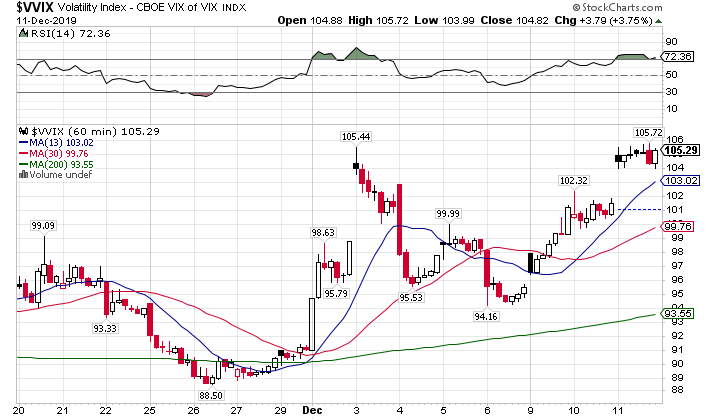
VVIX hourly chart
This is my favorite leading indicator of the markets. In this case, it’s revealing a different story.
Recall that the VVIX measures option activity on the VIX itself. Let’s look at the three clues:
- Equities appear bullish
- The VIX dropped accordingly
- But there’s a lot of option demand on the VIX
Here’s my take. I don’t see any problems with equities. We’re actually seeing traders buy downside protection through long VIX options rather than puts on stocks.
I don’t believe that the rally in bonds and gold indicate weakness in stocks. Remember, all three climbed throughout the year together.
Yesterday’s move doesn’t take them from their slightly bearish position. The TLT hasn’t broken its pattern of lower highs and lower lows on the daily chart.
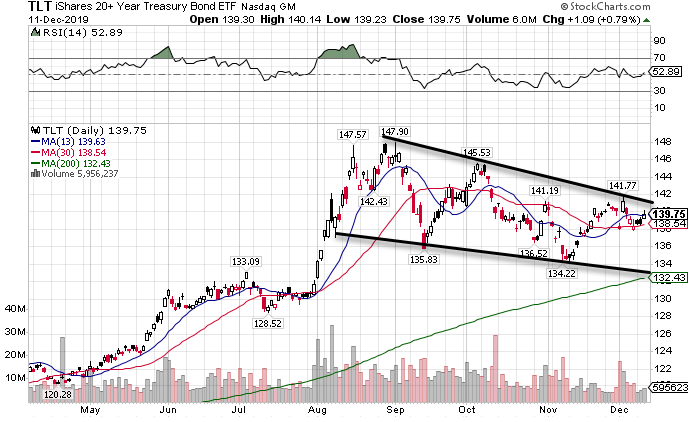
TLT daily chart
Bonds should make their way down to the 200-period moving average before changing trends. Keep in mind…they can trade all the way down there and still keep a long-term bullish form.
Gold is in the same spot, trading in a tight bearish range well below the highs.
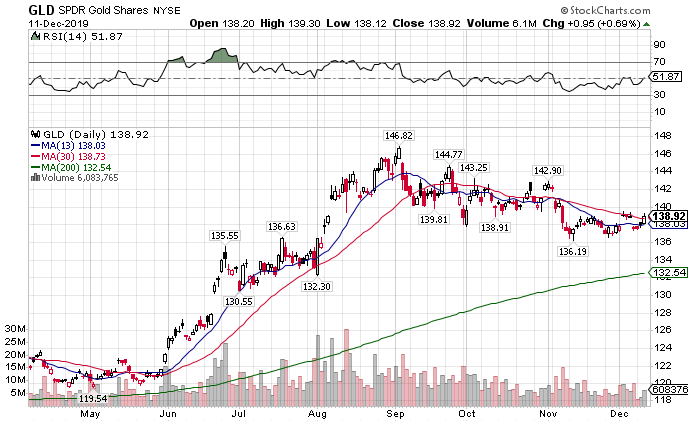
GLD daily chart
I see an almost identical outlook as bonds. The 200-period moving average calls like a siren’s song. That lines up with the last breakout area as well.
One new trend that’s cropped up – the bearish dollar. In fact, since the beginning of October, the selloff in the greenback accelerated.
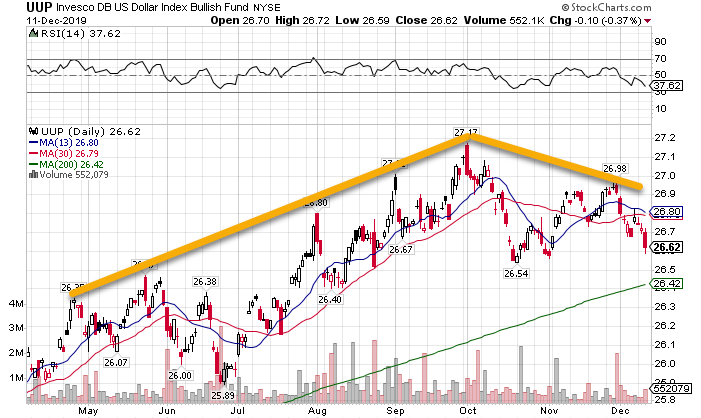
UUP daily chart
There’s a clear inflection point where sentiment shifted. Not surprisingly, it is pointed towards the 200-period moving average. However, I think this one has further to slide. This was a crowded trade that could take a while to unwind.
We’re also seeing a slow grind higher in crude prices. Talk of OPEC and non-member states managing production seems to be strengthening price.
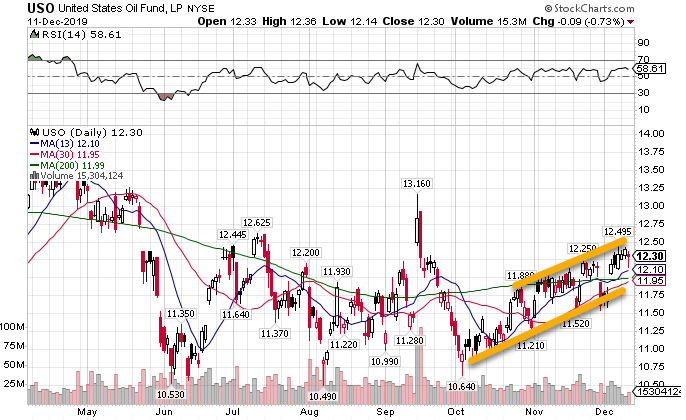
USO daily chart
Crude spent the last few months building a solid base, trading higher in a tight channel. Although global demand remains dormant, China’s industry measurements indicate a bottom.
That still doesn’t help natural gas prices, which keeps a lid on the U.S. energy sector. Talk of a cold winter did little to quell bears.
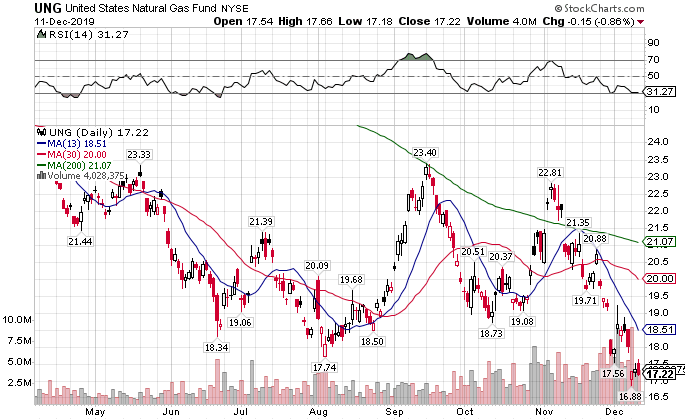
UNG daily chart
We have already seen smaller drillers go under in favor of cash-rich behemoths. If natural gas prices don’t recover by the end of winter, there could be another wave of defaults that consolidates the industry.
The real standout yesterday had to be semiconductors. Prone to boom and bust cycles, the SMH ETF finished up 2.74% on the day, setting it at all-time highs.
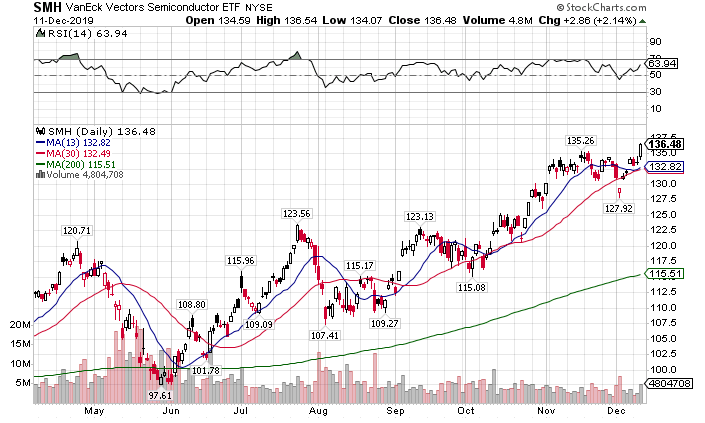
SMH daily chart
While I made money on the downside the other week with AMD in my Bullseye Trade of the week, I think there’s a lot of solid semis that could take another leg. Some of your biggest names including Intel, AMD, Skyworks have a room to reach their highs.
That’s why I’m looking for my money pattern crossover on the hourly chart in some of these names for the next week.
You can catch all the action, live, in real-time at Total Alpha.
