Congratulations, you’ve almost made it through the trading week…and what a roller coaster ride it’s been! Let’s get you squared away with where things stand after some wild market action with the midweek market update.
The SPY managed to fill the gap today left open from Monday’s massive decline. That comes after a sharp reversal Tuesday that took most of the day to play out.
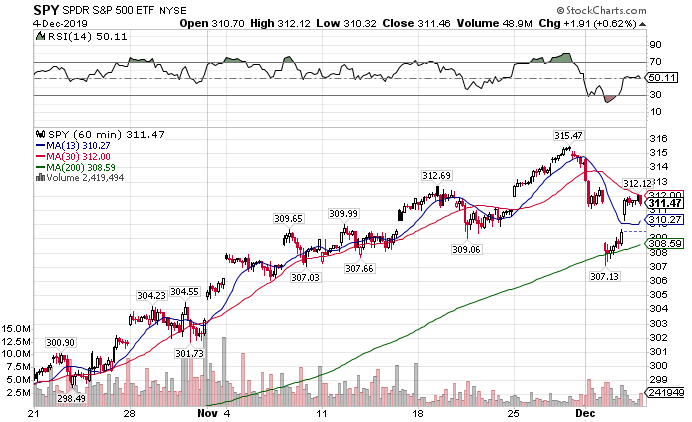
SPY hourly chart
Earlier this week, I said I expected the market to make its way to the hourly 200-period moving average…which is exactly where it stopped. And I will put my money where my mouth is.
Total Alpha Portfolio midday yesterday.
That’s why I look at the other markets, including Bonds, Gold, and the Dollar, for additional information.
Equity winners – Small caps, energy, utilities, and consumer staples
As I outlined at the beginning of this week, I expected small caps to outperform the broader market. The weekly close above the trading range that bound it all year told me it wants to move higher.
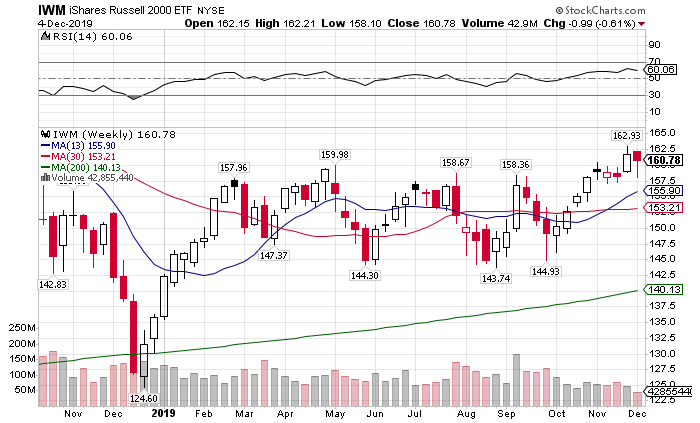
IWM weekly chart
We’re already seeing the IWM outperform the SPY by 0.15% in the last three days. That’s come at the expense of the QQQ, which underperformed by 0.32%.
The real high flyer comes from the least likely of places. Energy stocks (XLE) are down a paltry 0.36% compared to the SPY 1.02%. Much of that comes on the back of rallies in both natural gas and crude oil.
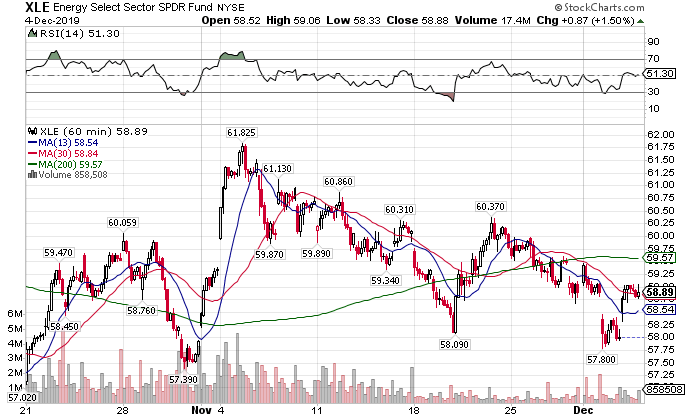
XLE hourly chart
Crude oil itself is up 5.17% this week. However, it finished down 4.75% last week when the SPY gained 0.75%…so it’s really just playing catchup and adding a bit to the top.
Natural gas looks more like an oversold bounce. The commodity fell a whopping 17.09% last week, creating a pop this week of 3.97%. It’s got a very long way to go before it shows any semblance of strength.
Utilities continue to perform well alongside bonds. The cheap yields in treasuries force safety investors to search for return, which often drives them into high dividend stocks.
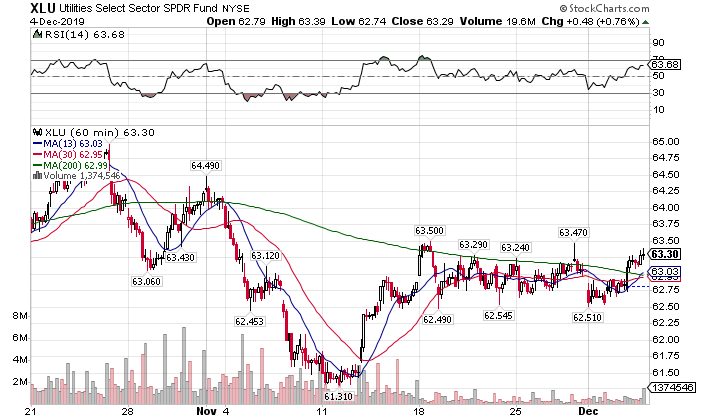
XLU hourly chart
Those with a little more risk tolerance tend to stick with consumer staples. They may have smaller dividends, but offer more exposure to growth.
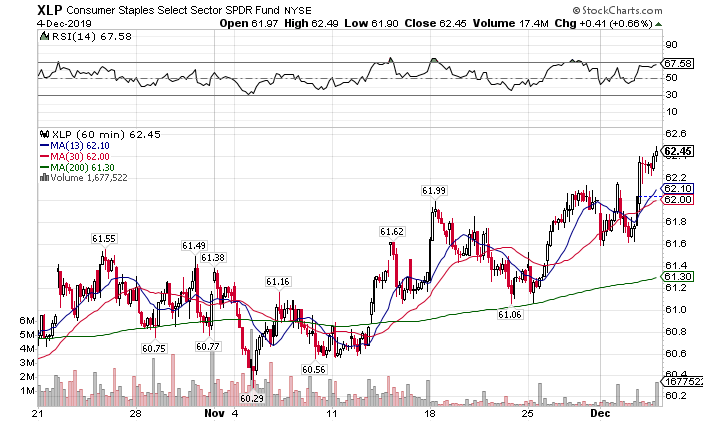
XLP hourly chart.
Safety Trade Outperformance
Bond ETFs also performed exceptionally well off the back of equity declines, up 1.2% for the week.
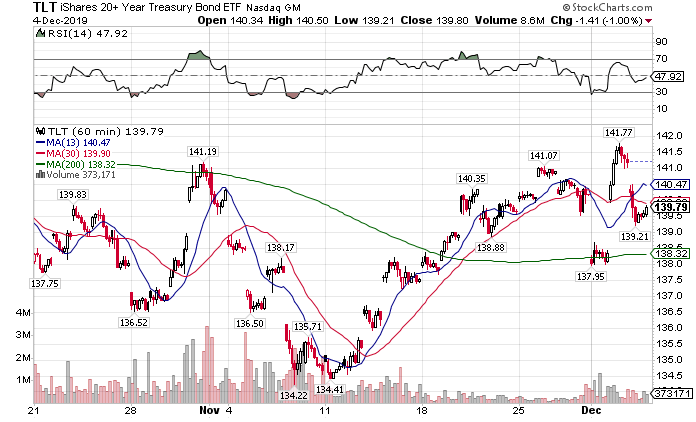
TLT hourly chart
This is a crucial hint. For the majority of the year, bonds and stocks traded together. We only saw them decouple and trade opposite one another this week (historically normal behavior).
Following a close second are the gold ETFs. GLD climbed 1.17% this week so far.
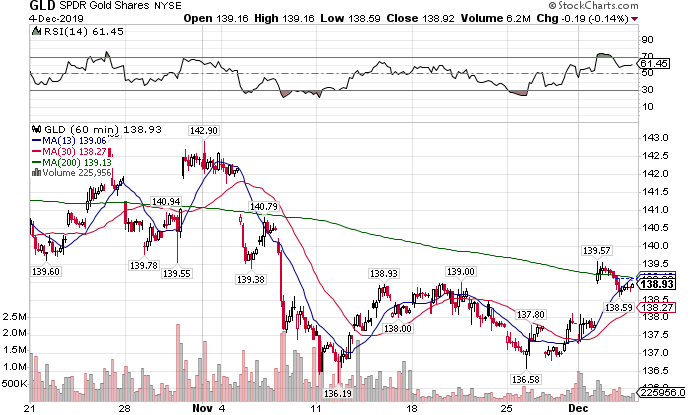
GLD hourly chart
Poor performers – The Dow, transports, and the dollar
The biggest loser this week so far has been the Dow Industrials (DIA). Though a small index, it’s down 1.58% on the week.
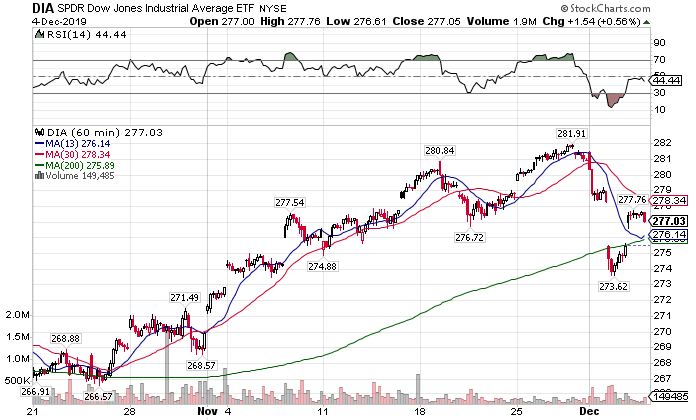
DIA hourly chart
The real loser this week has been transports. They’ve been just obliterated. The IYT ETF is down 2.88%, nearly double the Dow’s performance.
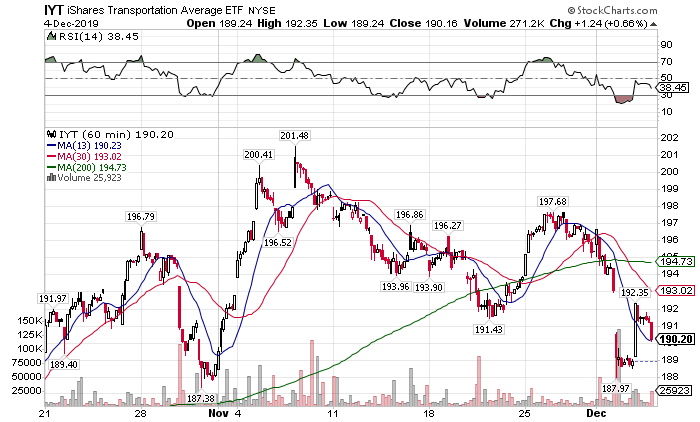
IYT hourly chart
This could be a harbinger of doom for any Dow theorists.
The real head-scratcher is the dollar. No matter when you looked, the dollar had been the strongest performing area week after week, month after month. So it’s a bit shocking to see it down 0.68% on the week.
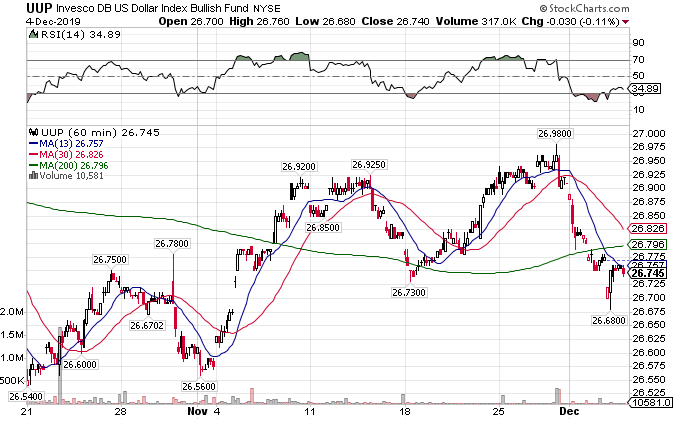
UUP hourly chart
That may not seem like much to you. But it’s almost a third of the monthly range.
Go no-where – Healthcare
Here’s an oddball for you. Healthcare stocks are flat on the week. It’s impressive given all the political drag this sector has.
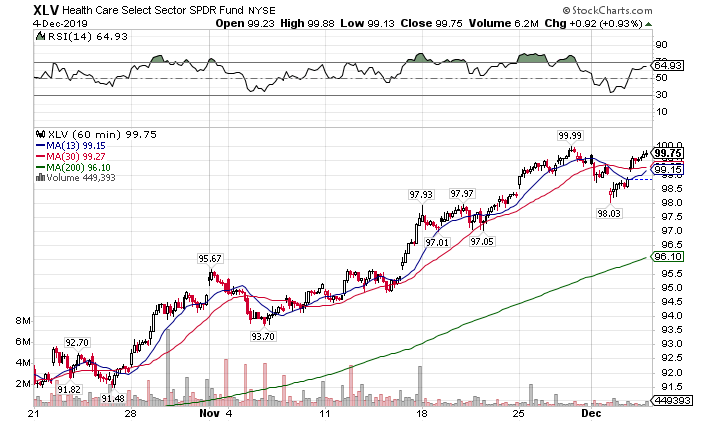
XLV hourly chart.
Most volatile – The VIX
Last week, the VIX printed prices under $12. That’s extraordinarily cheap…and it indicated complacency among investors. It’s not a surprise that the VIX shot up nearly 41.77% at its peak this week, while still settling up 16.63%.
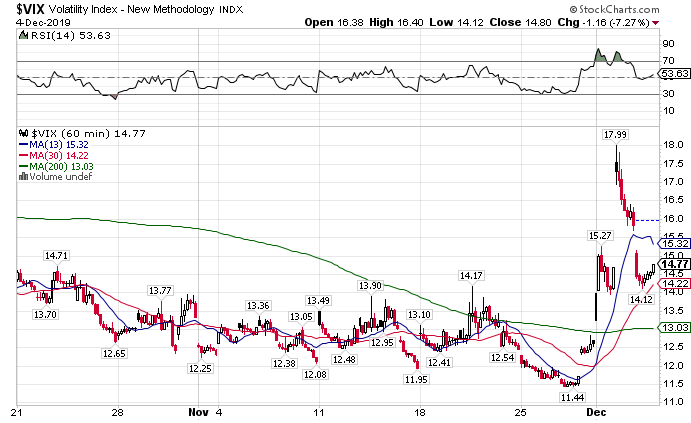
VIX hourly chart
My analysis – we’re heading lower before we head higher
Let’s look at the facts:
- Equities haven’t seen a selloff since…well it’s been a while
- Investors didn’t buy enough protection
- Stocks rose on little volume
- Now, the VIX shoots through the roof, and all the safety trades outperform
- But the dollar is noticeably weaker
It’s pretty clear that we’re seeing money move into the safety trades after a monster run. However, even though the volume on the downside was much higher than the upside, it’s still pretty light.
Outside of a news event, we’ll likely float sideways to higher through the end of the week. From there, I expect we’ll see one last push lower before we get our Santa Clause Rally.
How I plan to profit these next two weeks
That’s for me to know and Total Alpha members to find out. There’s plenty of egg nog…so pull up a chair.
Click here to join Total Alpha.
