I wasn’t surprised to see volatility return after the signals the market was throwing last Friday – the VIX spiked over 7%, the markets had a mini-selloff, and a few stocks ran into liquidity issues on Wednesday.
Traders must have realized their mistakes, as they pushed the VIX up nearly 20% at one point yesterday.
A quick look at stock futures this morning, and it looks like we’re in for a potential bloodbath.
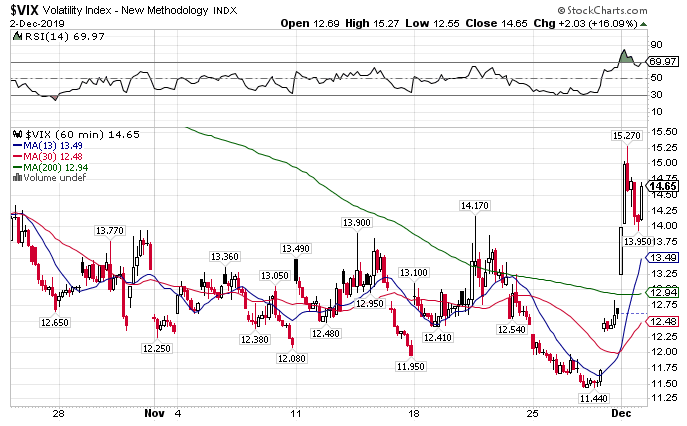
Yesterday’s VIX hourly chart
While the financial media might try to strike fear in you if the selling pressure continues. I want you to know one thing—this is the time experienced traders clean up.
I want to show you how I structure and enter my trades to short volatility at the highs.
My weapons of choice?
Volatility ETNs like VVIX, and UVXY.
And you know what else?
Today’s environment sets the table for a potential trade.
I use VVIX to time my entries into the market and play option trades on leveraged ETFs like the UVXY.
Most people don’t realize the VVIX’s forecasting power. I’ve used it over and over to time market lows and ride the strong bounces.
Combine this with options trading, and you’ve got a winning strategy.
Let’s get to it, shall we?
Why this trade works
I want to quickly explain the reasoning behind this strategy. It will help you understand how to put things together.
The VIX measures the annualized volatility expectations for the S&P 500. Its dollar value represents the expected percentage change. So, a $15 value equals a 15% change in the market. The CBOE derives the value from all of the put in call options on the S&P 500.
This doesn’t mean it expects a 15% move within 30 days. Rather, it says if you annualized the expected move over the next 30 days, it would equal 15%.
There is always an underlying assumption of volatility in the market. That’s why it always reverts back to its mean around $15.
You can see it on a quarterly chart below.
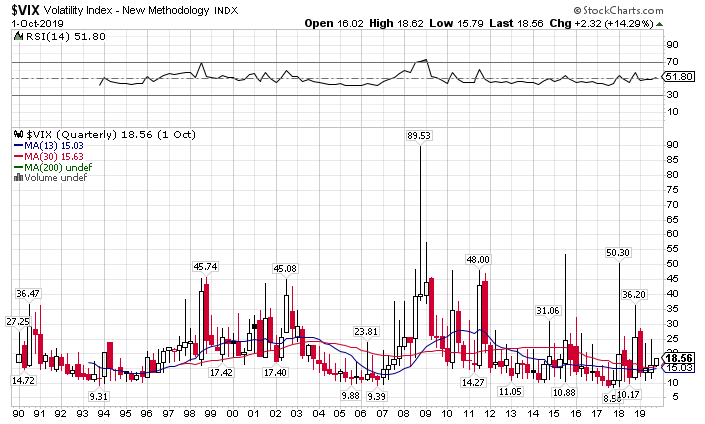
VIX quarterly chart
Timing the trade
The key to timing this trade is using the VVIX. This index measures the volatility of the VIX. Simply put, it measures option demand on the VIX.
Just like the VIX, the VVIX is mean reverting. You can see how this works on the monthly chart below.
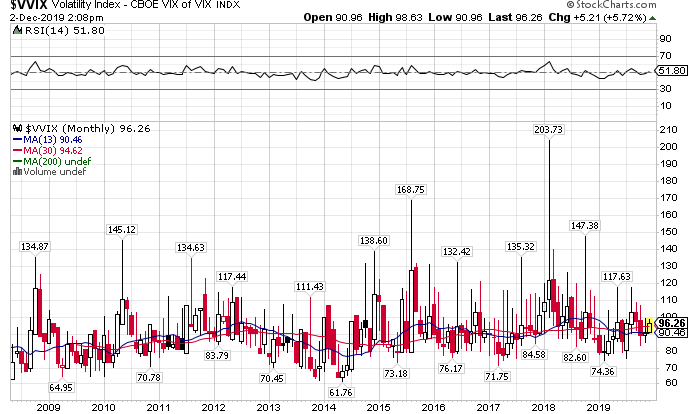
VVIX monthly chart
Note: The VVIX isn’t as old as the VIX. Hence why there’s less data.
I look for the VVIX to enter a zone above $115.00. That is the signal that volatility is overbought, and I want to go short. This trade doesn’t set up all that often, maybe a few times a year if you are lucky. But it has an extremely high probability of success when you play it right.
Structuring the trade
I like to use leveraged ETF’s for my trade. They have a natural decay working against them on top of mean reversion. The UVXY works great for this strategy. It tracks 1.5x the movement of short-term volatility.
My trade of choice is to sell call spreads. This puts me in the driver’s seat for the entire trade. I control my risk, as well as put myself at a statistical advantage from the outset.
A call spread is easy to execute. You start by selling a call option at or above the current stock price. Then, you buy the same number of option contracts at a call strike that is higher than the first call strike. Both of these must have the same expiration date.
Here’s a quick example:
- The UVXY trades at $35.
- I want to sell 10 contracts of the UVXY for an expiration 30 days from now at the $36 strike price.
- Then I buy 10 contracts of the UVXY for an expiration 30 days from now at the $37 strike price.
When you execute this trade, you receive a credit (payment) to open the trade. The goal is to have the UVXY trading below the lower strike price at expiration. You can also close the trade early for a portion of the total profit.
Let’s use the previous example to break down payments.
- I sell 10 contracts of the UVXY for an expiration going out 30 days at the $36 strike price.
I receive $2.00 for the sale.
- Then I buy 10 contracts of the UVXY for an expiration 30 days from now at the $37 strike price.
I pay $1.75 for the purchase.
- My maximum possible profit is the difference between what I sold and what I paid.
Max profit = $2.00 – $1.75 = $0.25 per contract
This comes out to $0.25 x 10 contracts x 100 shares per contract = $250
- My maximum possible loss is the difference between the strike prices less the amount I received.
Max loss = $137 – $136 – $0.25 = $0.75
This comes out to $0.75 x 10 contracts x 100 shares per contract = $750
So my maximum profit potential is $250 and my maximum possible loss is $750.
In this trade I like to have a risk to reward of 1 to 1. That means I want to set up the trade so that my maximum profit and maximum loss are equal.
I go for expirations that go out at least a month or more. That gives me time to take off the trade early at a portion of the maximum profit. Remember, you don’t have to wait for the maximum profit to close the trade. Getting 50% of your possible profit is great!
Want to see it in action?
Then check out Total Alpha. You get to watch my streamed trades live. This lets you follow along and learn in real-time.
