It’s the midweek update, where I’ll be spending some time walking you through what’s happening in volatility, energy, currencies, bonds and small-cap stocks.
Let’s get to it…
Yesterday appeared calm on the surface. But look a little deeper, and you’ll notice something quite interesting— something we haven’t seen in seven months.
The VIX dropped to a low of $11.42, its lowest mark since April 17th.
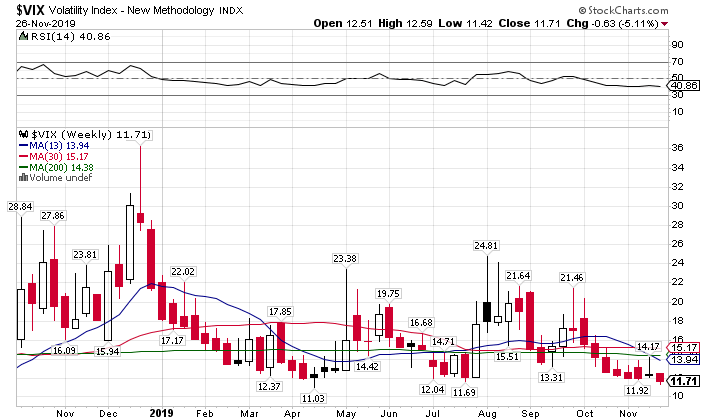
VIX weekly chart
Remember, a low VIX reading means traders are typically complacent and not worried about a market correction or even hedging their positions as much.
An incredible move given the wall of worry the market has overcome over the past three months.
In fact, the VVIX – which measures volatility of the VIX – came crashing down the past few days off its intermediate highs.
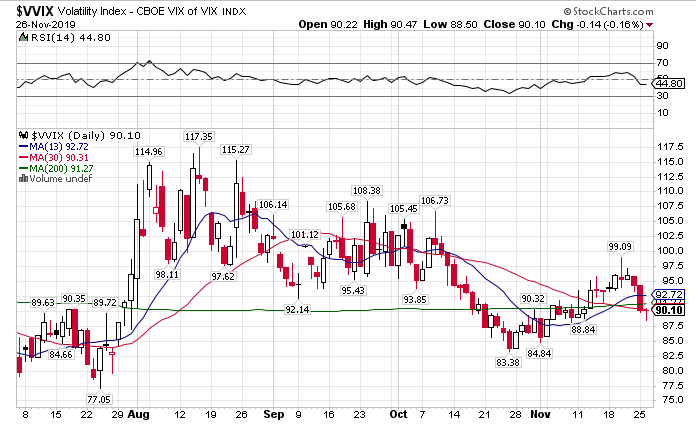
VVIX daily chart
There is actually a benefit to low volatility—and that’s the price of options generally become cheaper.
I took advantage of the low implied volatility in Disney and bought some calls. A trade I plan on riding out through Friday.
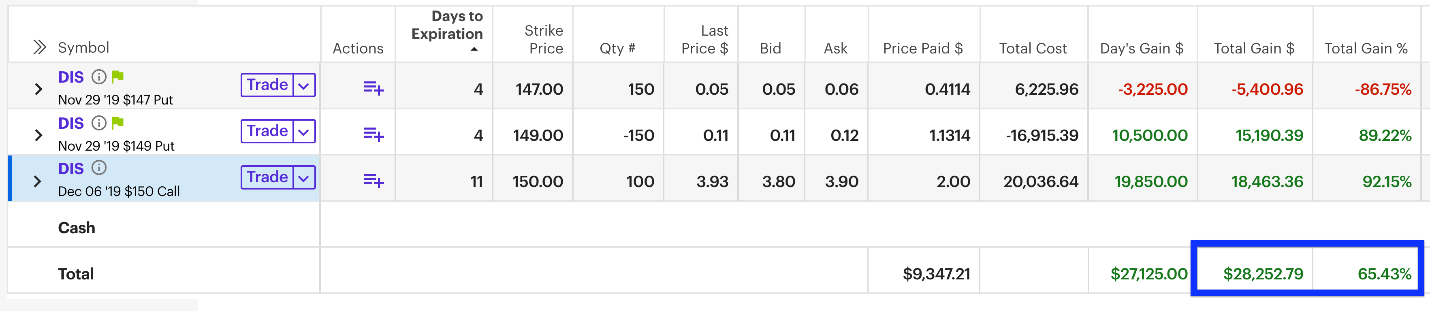
This Total Alpha trade comes on the heels of a win for $71,000 last Friday afternoon!
Of course, that’s not the only play I got going on this week. Several opportunities are popping up across various sectors. Allow me to get you up to speed on the ones that can make us the most money.
Small-cap standout
The lag of small caps might finally be over. The IWM finally breached the upper end of their trading range that’s held them for the entire year.
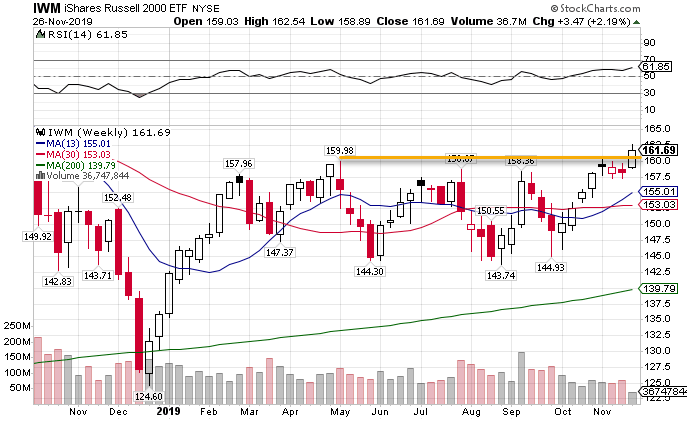
IWM weekly chart
I see money flooding into small caps as fund managers try to play catchup through the end of the year. That will put a cap on the large-cap names that outperformed this year like AAPL, MSFT, and others.
Natural Gas continues to obliterate energy names
Traders refer to Natural Gas as ‘the widow maker.’ It can have extremely violent moves that happen in a matter of moments.
It looked like prices might make a resurgence this past month. Talk around the water cooler was there were fewer players in the U.S. production markets. Tighter credit supposedly forced out smaller balance sheets, leaving the big boys to play.
The price of Natural Gas says otherwise. Despite a run of over 23% from mid-October to mid-November, Natural Gas threw away all its gains.
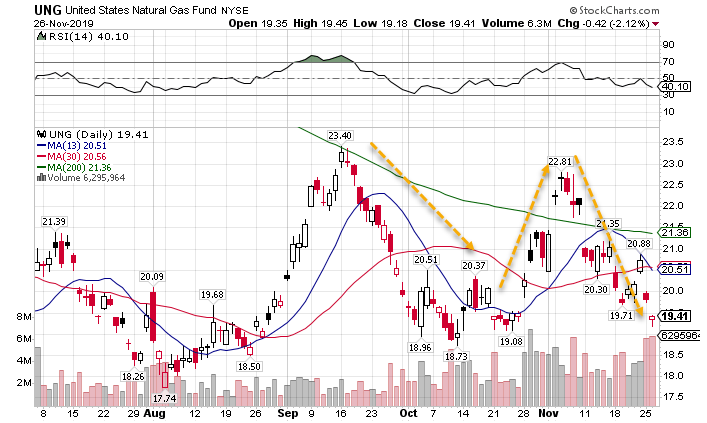
UNG daily chart
Energy companies from producers to drillers rely heavily on Natural Gas prices. Even with crude prices showing signs of life, the overall sector remains mired in the doldrums.
Bonds refuse to give up ground
It’s pretty unusual to witness bonds and stocks trading up at the same time. Typically, money seeks safety in bonds because it sees stocks as too risky. However, the global central banks sort of threw all this for a loop.
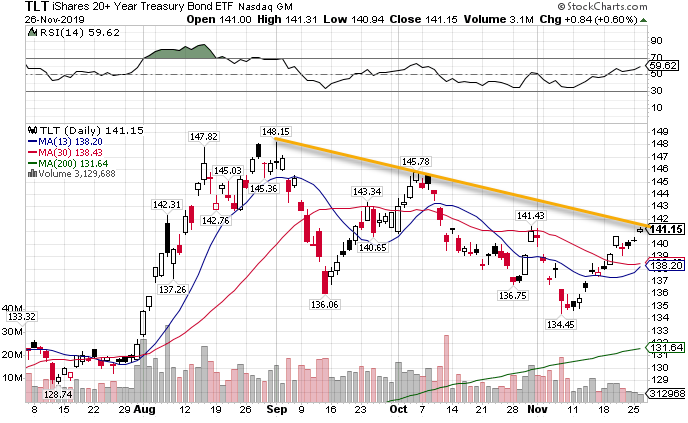
TLT daily chart
Bonds appear to be coiling for another move higher. Whether that brings stocks along is anyone’s guess. I wouldn’t be surprised to see the trendline that connects the recent swing highs act as resistance. But, if the price continues to push past that, then you can expect higher prices soon.
The dollar keeps its bull run
Not even the Fed can keep a good dollar down. The demand for the U.S. currency remains as strong as ever.
U.S. bonds and dollars are likely the recipients of being the best of the worst in the global economy. With negative rates on other bonds, the U.S. dollar still remains top of its class.
I do like this ‘W’ pattern on the dollar daily chart. Price already closed above an intermediate high, came back to retest, and pushed off. I think we could be seeing another leg higher getting ready in the dollar.
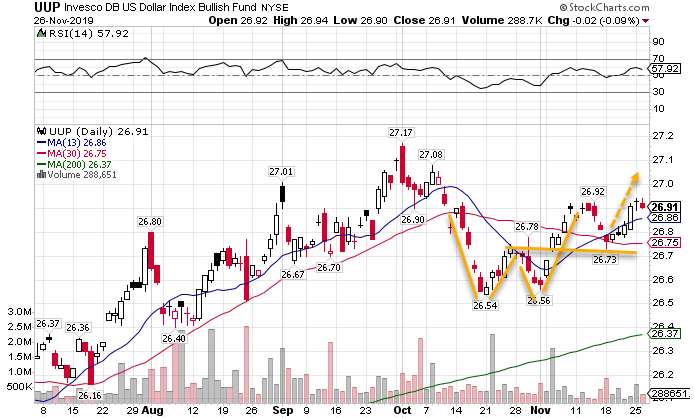
UUP daily chart
Don’t count out volatility quite yet
True, volatility came down quite a bit. That doesn’t mean there isn’t an opportunity here. The VIX getting down to these levels delivers a high probability trade to go long volatility.
The VVIX put in a Doji candle on the daily chart which suggests that the VIX itself may be bottoming out here. It’s also into an area where several moving averages converge. That should provide support, which is bullish for the VIX.
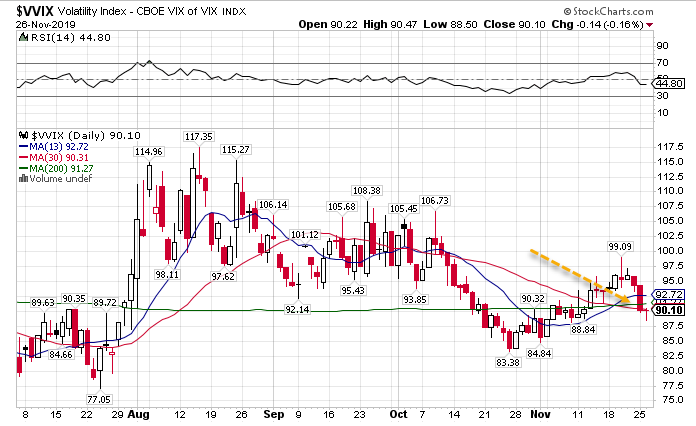
VVIX daily chart
I like to play options through either calls on the VIX itself or a leveraged ETF like the UVXY.
Looking for solid stocks and charts
When things get frothy, you still have places to make money. I like to stick with stocks that I know and understand their charts.
Disney (DIS) continues to behave bullish no matter the market conditions. Ever since it gapped up earlier this year, it’s been unstoppable. It’s one of my favorite stocks to trade in my Total Alpha portfolio.
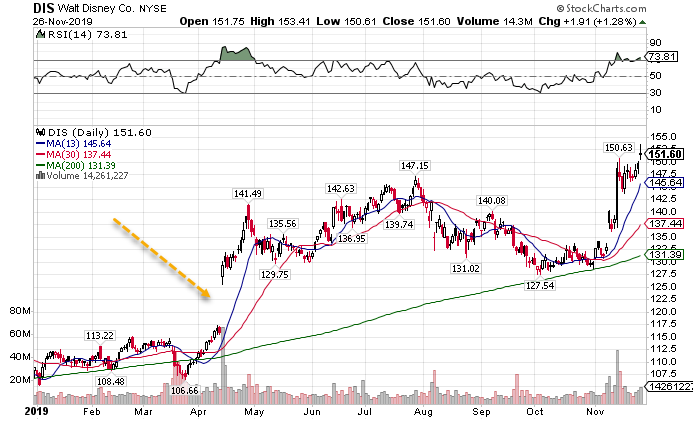
DIS daily chart
This past week I looked at a clear bullish crossover occurring on the hourly chart. That comes after it has already made a powerful move and consolidated.
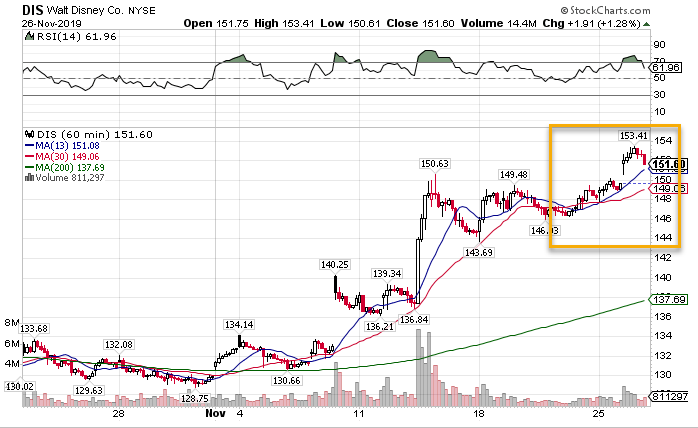
DIS hourly chart
I like playing continuations here when the chart ratchets higher, moves sideways, and then start to inch it’s way upward again.
Friday after Thanksgiving is my favorite trading day
I love trading Black Friday more than most other days of the year. There are so many stocks to play right now my mouth is watering.
You can still get in on these plays before the market opens.
