I don’t know about you, but I’m always excited to trade on Monday. Maybe it’s all the money that is flying around from M&A action—broker Charles Schwab announced it’s making an offer to acquire TD Ameritrade for a cool $26 Billie…
Or maybe it has to do with the way I finished my trading day on Friday…
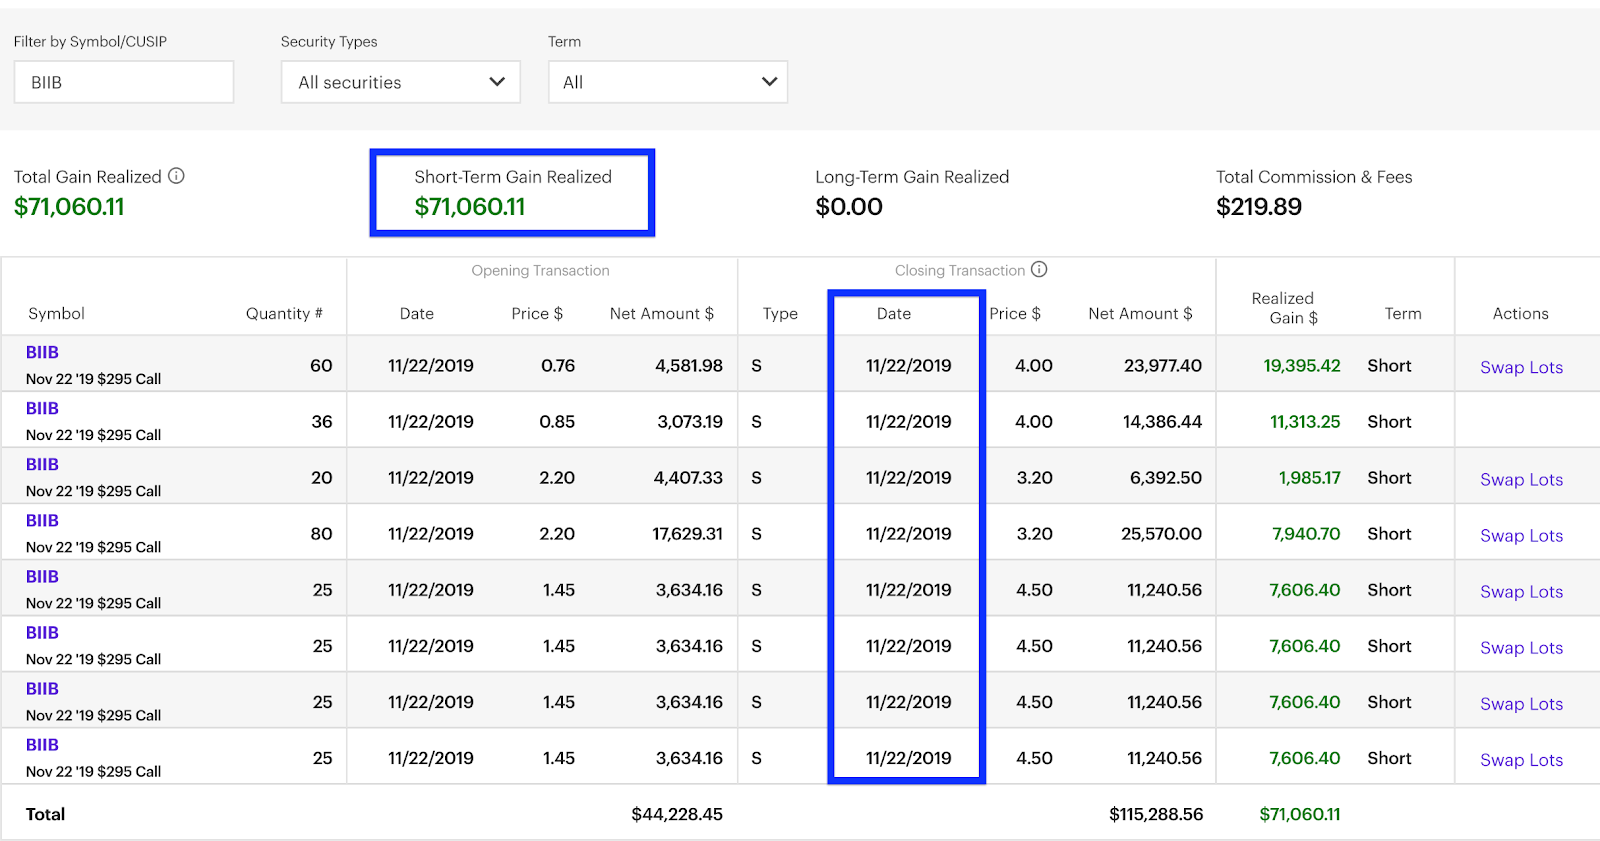
A Nice $71K trade in BIIB options on Friday before lunchtime. Not a paid-up member of Total Alpha? Click here to join.
Despite it being a shortened trading week, I go about each Monday the same—by breaking down the big picture to try and identify relationships and trends.
What is it that I’m looking at to develop this big picture view?
Simple.
I’m eyeing stocks, oil, volatility, gold, treasuries, and the dollar.
Here’s your Monday intermarket analysis:
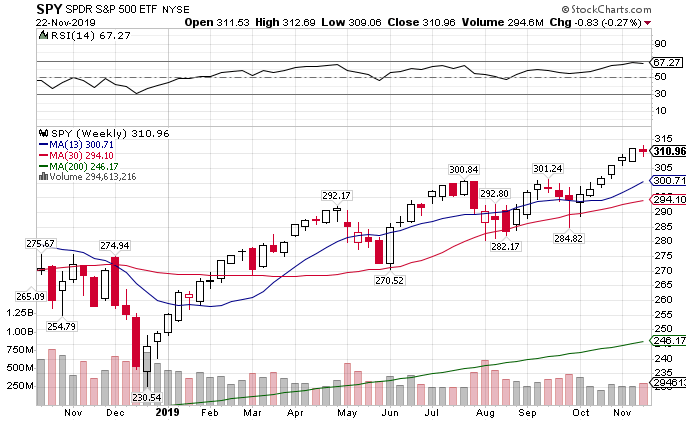
SPY weekly chart
If that’s the best pullback the market can muster, it’ll be a long while before we see any downside.
The few times that bears looked like they gained control, they got shot and laid out as carpets in the bull cabins. Those were the few days that we saw any real volume.
Otherwise, it’s the same old story of large-caps rising higher with small-caps getting left in their wake.
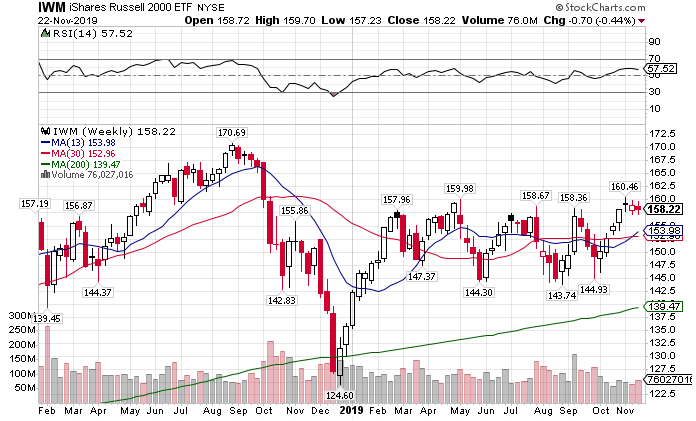
IWM weekly chart
I wouldn’t be surprised to see buying into the end of the year across the board from fund managers dressing up their portfolios. You know there’s at least a few out there that were short the entire year that need to cover their tracks.
Energy might have some power
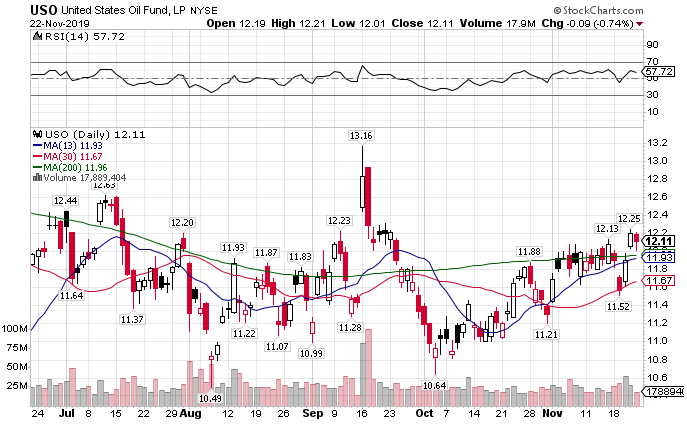
USO daily chart
There’s been lots of speculation that crude put in a real bottom. Baker Hughes rig counts show dropping numbers. However, inventories remain bloated, and output keeps getting more efficient.
The real driver for this market will always be global demand. With the world economy languishing, it’s tough to see any real rally happening without a change in forecasts. Right now that’s a tall order given China’s economic contraction.
Bonds trade in a defined channel
U.S. bonds remain the prettiest pig with lipstick. Like stocks, bond volume continues to dry up. That’s left prices floating in a channel lower since early August.
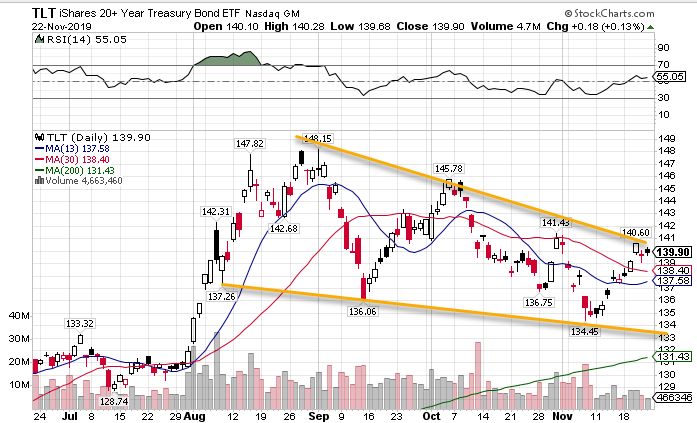
TLT daily chart
At some point, the range will compress enough to force a violent move higher or lower. If I had to pick a direction right now, I’d slip on the bond bear suit.
Gold may be getting ready to crack
Drifting lower on declining volume is much worse than higher. It’s like watching a car crash in slow motion.
Interest in gold continues to decline every day. China has already grabbed much of the bullion they wanted for their central banks. Now, we’re left with the tail end of their purchases.
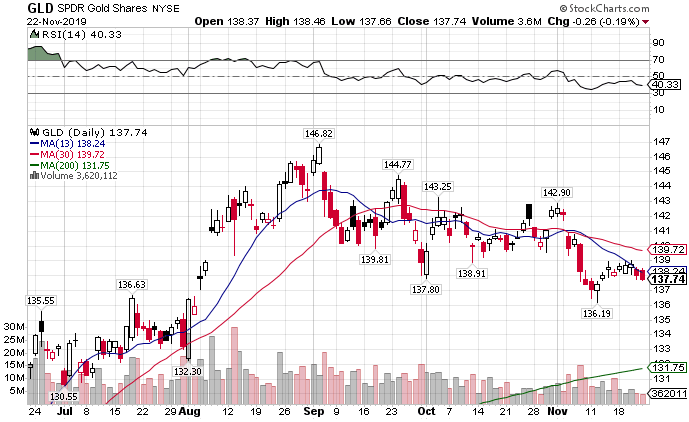
GLD daily chart
The GLD remains locked into lower prices by the 13-period simple moving average. Its next support area wouldn’t come in until the gravitational line at $131.75.
Never bet against the dollar
No matter who tells you the dollar is overbought…they turn out to be broke. Betting against the dollar works about as well as going against equities.
Other than a short reprieve in October, the dollar resumed its trend higher off a quick double bottom.
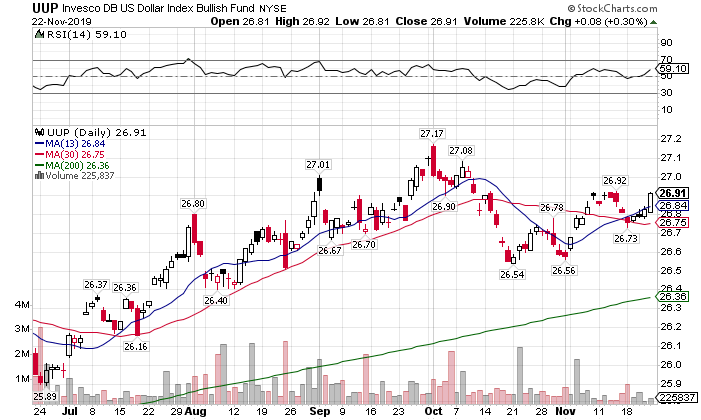
UUP daily chart
All the talk by global economists about replacing the US dollar doesn’t jive with reality. Every global country still needs dollars to trade. No other currency and government debt offer a better risk/reward than the U.S.
Usually, a strong dollar would lead to lower stock prices. However, both have risen in tandem for several years now. Maybe the old economic correlations broke… or perhaps we’ll face a day of reckoning.
Volatility says to enjoy your holiday
The VIX tried to briefly pierce $14 this week but had about as much energy as you will after this week’s meal.
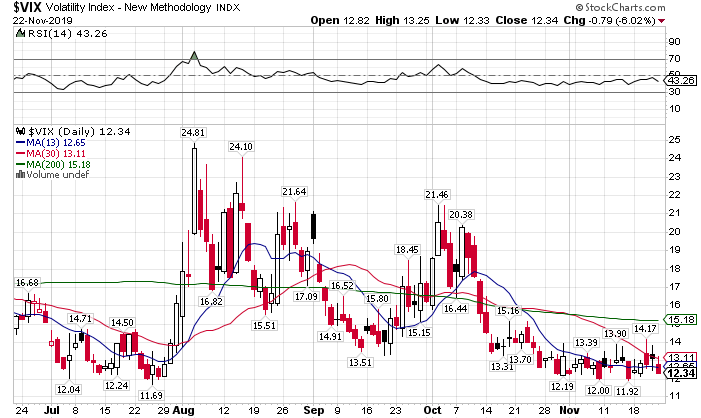
VIX daily chart
What’s fascinating is the VVIX (the VIX of the VIX) had been suggesting that we’d see more volatility since late October.
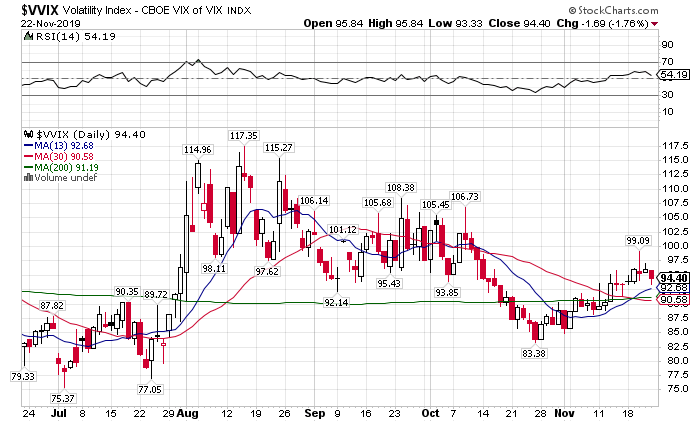
VVIX daily chart
The higher we go the harder we fall. I don’t expect the VVIX to drop without the market retracing a portion of its run.
Before you stuff your face, stuff your pockets with cash
And learn how to take trades that net $71,000 in a single afternoon… life-changing trades.
