Despite the mild sell-off in the market the past few days—no one can deny the bulls are in charge. Their confidence grows day by day.
After all, it was just a few days ago when the bankers at Goldman Sachs raised their 2020 outlook for the U.S. stock market.
They believe stocks can surprise next year if we see the following:
- No additional tariffs happen
- Manufacturing in export-heavy China and Germany bottomed
- Lower interest rates will take 3 quarters to flow through
- Stabilization in oil prices
My response to their note:
In fact, what I’m reading from the market is totally different from what the bankers on Wall Street are telling investors.
There are some key turning points that you should be aware of. As well as, a potential shift that could be happening right now. If you are able to spot it, then you’ll be in a position to potentially profit off it.
What am I referring too?
Market winners
One market stood out on the day… if you could call it that: small caps. The Russell 2000 small-cap index measures smaller companies in the U.S. market. These businesses should benefit from a growing economy more than big-caps.
However, they’ve been rangebound the entire year and still have yet to break higher. Yesterday they finished up 0.37%, which isn’t saying much.
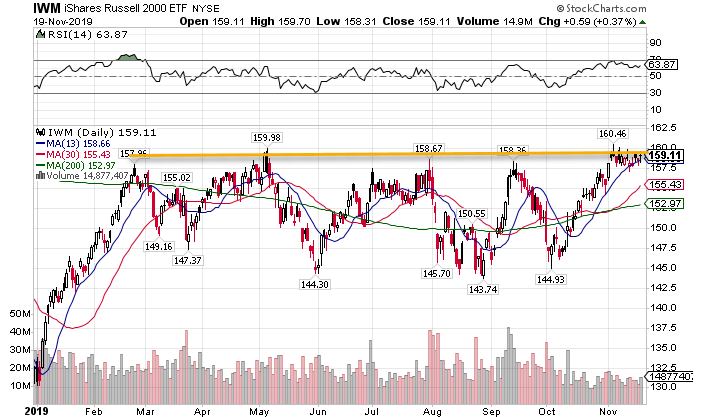
IWM daily chart
While the S&P 500 and Nasdaq 100 continue to make new highs, the Russell 2000 can’t even get above its interim highs.
It doesn’t seem likely that the economy is growing without bringing along small businesses. This market keeps me thinking that there is something amiss with the broader market rally.
Market losers
One of the worst sectors on the day was discretionary spending (XLY). Horrific performances by Home Depot (HD), Nordstroms (JWN), and Kohls (KSS) dropped the index by 1.1%.
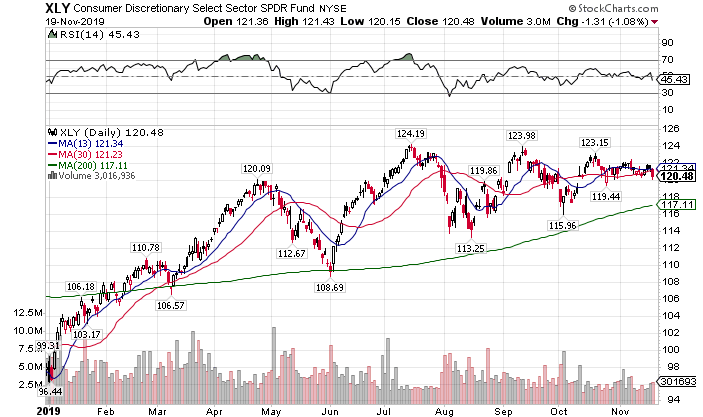
XLY daily chart
That still doesn’t compare to the energy companies (XLE) down 1.47% and oil and gas exploration companies (XOP) down a whopping 3.57%.
A deeper look into energy
Recall that Goldman expected oil prices to stabilize. They’re not the first ones to make this case. Plenty of analysts believe a host of factors will increase oil prices including:
- Fewer U.S. drillers due to tightening credit standards
- IPO of Aramco will force Saudi Arabia to curtail production to achieve higher profits
- Improving global demand by heavy consumers
So does the actual data support this? Well, the Baker Hughes rig count (counts the number of oil rigs in the U.S.) does show a steady decline in production rigs.
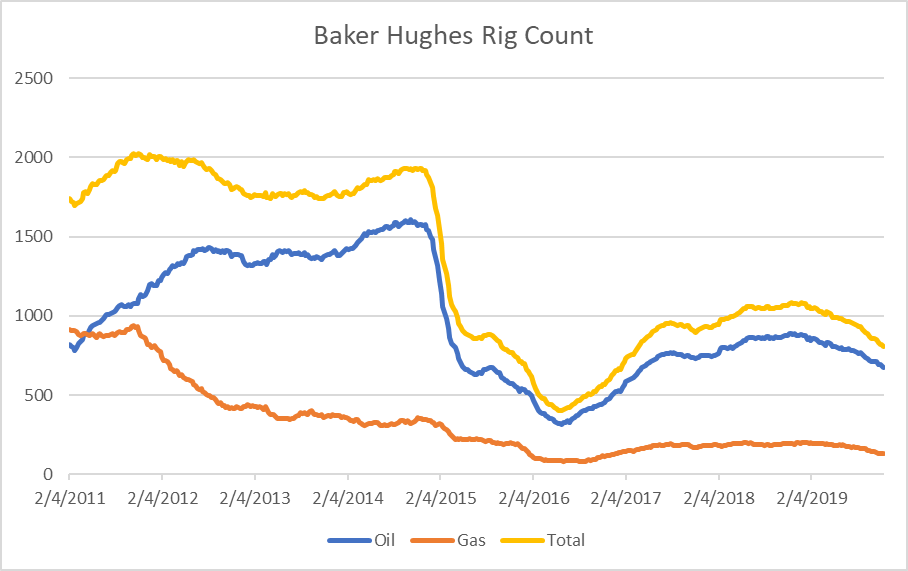
The thing is the rigs in service are getting more efficient.
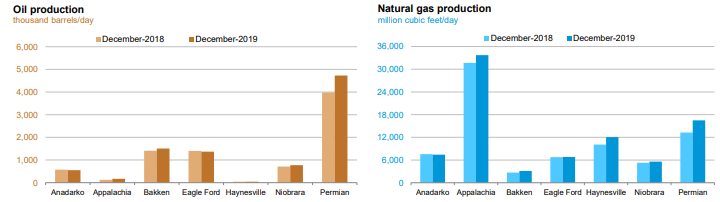
U.S. Energy Information Administration
It’s tough to say that the low rig count really matters when you have production in the Permian Basin jumping by nearly 20% year over year.
That’s probably why the oil markets are saying the run in crude might be overblown. Yesterday’s trading lopped off over 3%, putting crude down over 4% on the week.
Energy companies continue to drag on the S&P 500. You’re not going to get a major market rally until oil prices recover somewhere north of $60 a barrel. And right now it looks like they’ll hit $50 first.
The market you should have been watching
While nobody paid attention, the VVIX capped a 2% day, which put it in the crosshairs of a recently volatile range.
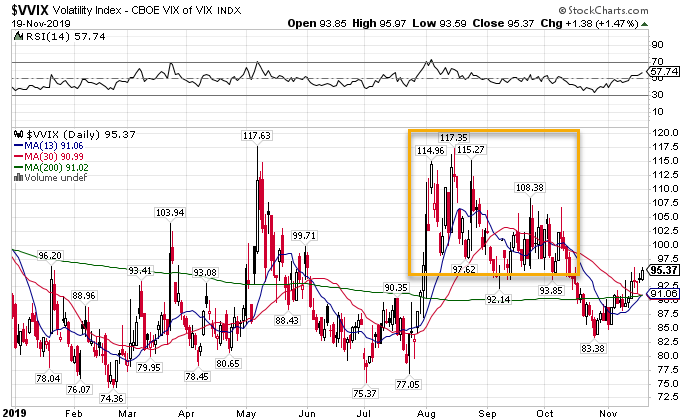
VVIX daily chart
The VVIX measures the volatility of the VIX, which measures the volatility of the S&P 500. Or simply, it measures option activity demand on the VIX.
You can bet your bottom dollar that if the VVIX starts closing the week at or above $100, that option traders are betting heavy and hard that volatility will jump soon. If they’re putting money to work, there is a reason for it.
The most resilient market
Gold bugs continue to win out week after week. Even the recent pullback couldn’t keep them down. While gold only finished up a touch on the day, it didn’t break down as far as bonds, and still remains extremely bullish.
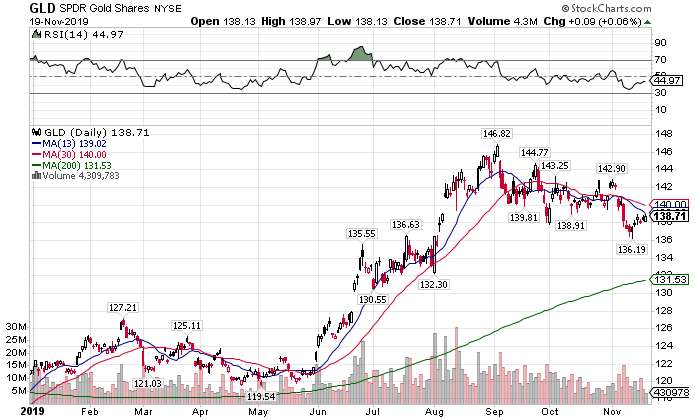
GLD daily chart
I played this strength by selling a put spread under the gold miners (GDX) last week, which is up near 100% of potential profits.

That’s not to mention a similar winner I have in TLT.
It all comes down to Total Alpha…learning how to trade the whole market and not just a sliver. So why not expand your horizons?
