Since the dawn of the markets, traders have been on pursuit for the one setup that ALWAYS wins, has nearly NO risk, and pays out mega-profits.
It’s the holy grail of trading—something for nothing.
I have yet to take a sip from the elusive chalice.
But when I learned about dividend collars… I thought it would all change.
After all, I just had to do execute the strategy to receive FREE dividends…right?
Wrong.
Plenty of traders walk in with this attitude and leave empty-handed. If you think you can eliminate all the risk, then you’re starting from a losing position.
But there is a place for the strategy in your trader’s toolbox. That is if you understand what its intentions are, and the ideal time to execute it is.
Of course, I won’t leave you hanging like that.
I’m going to teach you what it’s about, when to look to trade it, and which stocks it works best on.
Option collar basics
Most investors use collars to lock in gains on a stock that’s moved a lot or fear a potential downside risk.
Collars are neutral trades that cost little to implement, sometimes just the trading costs. The execution is rather simple.
- Own stock in increments of 100 shares (IE 200, 500, or 1,000 shares)
- Sell one call option for every 100 shares at a strike price above the current price
- Use those proceeds to buy the same number of puts at a strike price below the current price
- All the options should be at the same expiration.
The payout graph looks very similar to a call spread.
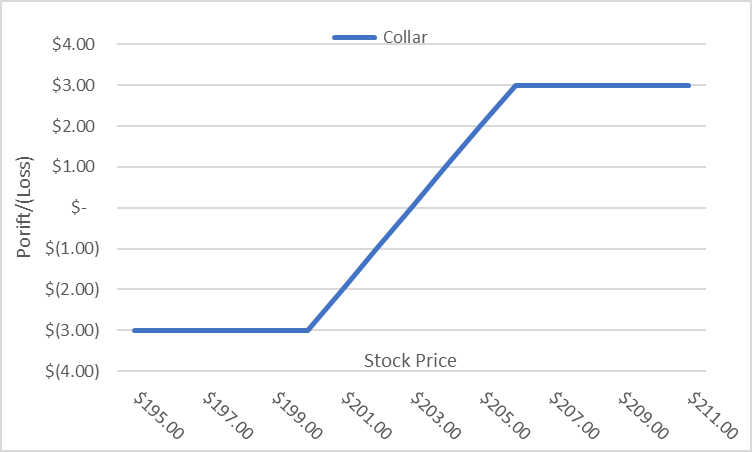
You can set the strikes as wide as you want. They define the range that you’re willing to let the stock move in.
In this example, we’ll assume the stock is trading at $203 and you own 100 shares. The put option strike is at $200 and protects from any losses below that price. The call option is at $205 and caps any upside at that price.
When you sell the call option you receive a premium. That premium should offset the cost of buying the put. That’s what makes this a neutral trade.
Note: These may not always tie out one for one. You could end up with a net credit or debit depending on how the options are priced and the strikes you choose.
Stalking the setup
I’m not the first one to come up with this idea. It’s obvious if you’ve been trading options for a while. That’s why option prices incorporate dividends into their premiums. If you try just buying the call and put at the current price, you’ll end up paying roughly the amount you’d get in the dividend.
So, that’s why it’s important to work with chart setups, specifically support and resistance levels. Combining trading techniques with this strategy increases your odds of success.
How I initiate the trade depends on where the stock is currently priced. If the stock is at a cheap level, with a high dividend yield and low downside risk, I want to buy the stock and buy a put against it. However, if the stock is trading at its highs, I want to buy the stock and sell a call against it.
Let’s use AT&T as an example. I’ve marked up the weekly chart to show a basic trading range.
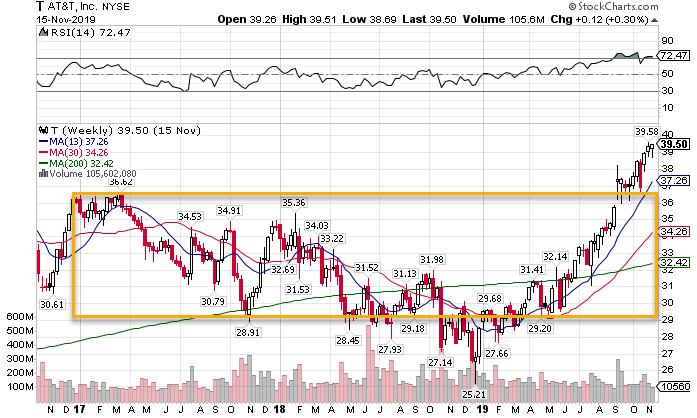
T weekly chart
Right now the stock trades well above the upper part of that range. So I’d want to buy the stock and sell the covered call against it. That limits my upside potential but pays me out for what looks like a lot of downside risk.
Now, if the stock trades down towards the bottom of the box, I want to buy the puts to protect the position. At that point, I’ll have the call to cap the upside and the puts to limit my losses.
Everything in between is just a trading range. Even if the stock trades outside of the strikes, the ‘collar’ the stock. In the meantime, I get to collect the dividend for as long as it pays.
Look to the bond market for guidance
One little secret I’ll share…the bond market can tell you a lot about where dividend stocks will trade. When bond prices go up, stocks that pay high dividends tend to go up (IE utilities, telecommunications, etc). Decreases in bond prices tend to bring down the price of those stocks.
You can use the bond market to gauge where things might be headed to help you decide how you want to structure the trade. If bond prices are at extreme highs (like they are now), then you know you have a lot of downside risk.
There are even more strategies to increase your performance just waiting for you at Total Alpha.
