The market sent a clear message this week to all the shorts:
Large caps lit up charts on a relentless march higher, while the Russell 2000 trails miles behind. The gap widened further last week with the SPY outperforming the IWM by over 1%.
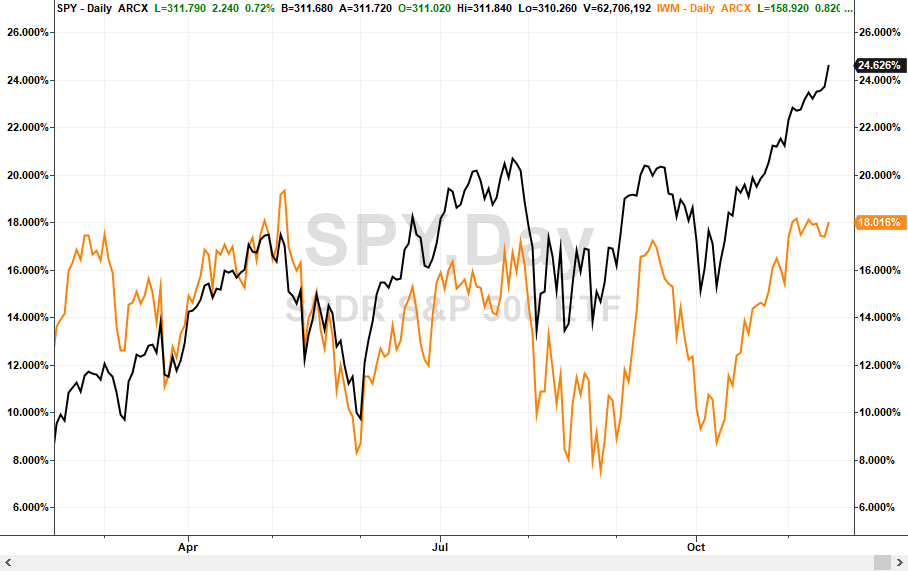
SPY vs. IWM YTD
What are we missing?
It seems rather absurd to reach new highs daily in the markets on the back of weak corporate earnings. Q3 earnings came in 2.3% lower than they did the prior year. We haven’t seen three-quarters of earnings contractions since Q4 of 2015 through 2016. And that’s what warrants new highs in the market?
Back then market participants at least seemed to understand that negative growth is bad. Major indices experienced massive drops during that time.
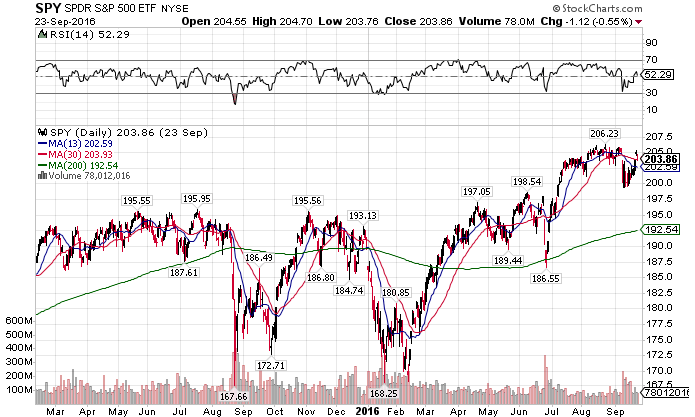
SPY daily chart
None of this insanity means the market will stop pushing higher. But it makes it really difficult to take anyone seriously that says the ‘fundamentals’ have improved. You don’t stare down a potential shutdown, an election, trade war, Brexit, and who knows what else and truly believe everything is sunshine and roses.
And look, it doesn’t make sense to me either. But that’s what makes this a traders market. You can still have a bearish outlook and pull through wins. It’s all about the setups.
Nike (NKE) is affected by international risk more than most companies. That doesn’t mean I couldn’t use a clear set-up to make a great trade for Bullseye and Total Alpha.
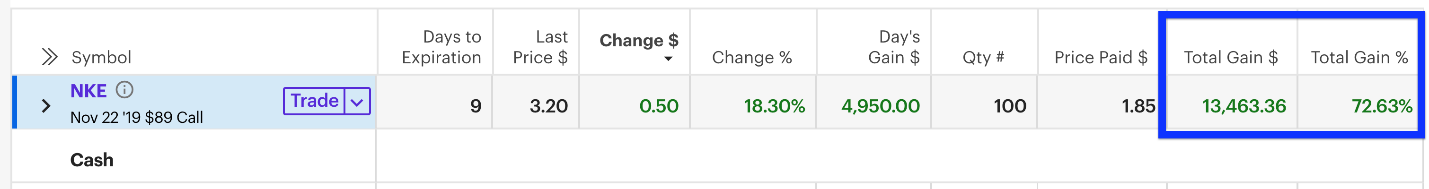
This is why learning how to trade is just as important as investing!
One market, in particular, looks very, very strong.
All the glitters is gold
Diamonds may be a girl’s best friend. But I have a solid relationship with gold. Last week’s price action indicated that the yellow metal found support at the $136 level.
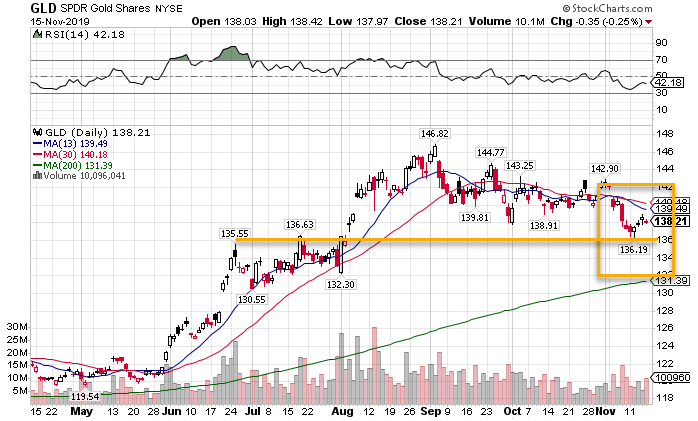
GLD daily chart
That let me play a put spread in the gold miners (GDX) ETF in my Total Alpha portfolio that paid out 100% of potential profits.
At first, you might think gold is trending lower. But when you break down to the hourly chart you get a different perspective.
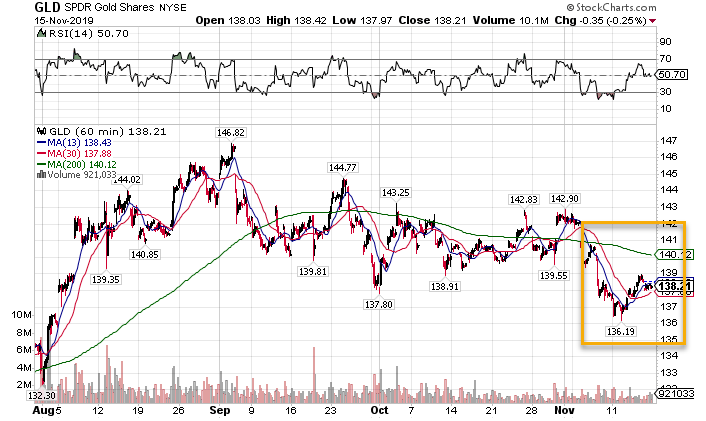
Gold hourly chart
I love seeing the money pattern crossover here, coupled with a nice consolidation pattern. At least in the short-term, this sets up for a nice trade to $140. That puts it right in line with the last broken support level and my favorite gravitational line.
Bonds look weaker but still strong
Normally you’d expect bonds to fall as stocks rise. This year has been anything but normal. While bonds aren’t hitting new highs, they’re still in a bullish position.
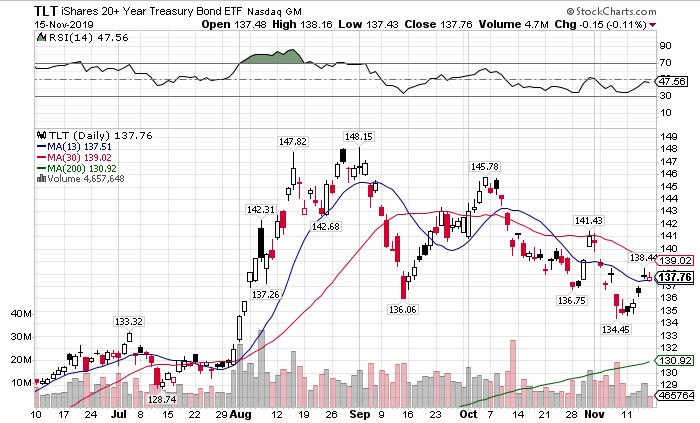
TLT daily chart
The TLT continues the slide that started in August. I don’t think it finishes until it gets down near $130. However, I see it running a bit more here in the short term. That let me go up over 86% in a TLT put spread.

I will say this until I turn blue in the face – This is why learning to trade is so important!
The VIX presents an incredible opportunity
Nathan Bear wrote about this trade in his Weekly Money Multiplier letter recently. You can check out the article here.
The VIX reverts back to the mean over time. It never continually rises or falls. Eventually, it floats back to around $15 give or take a couple of dollars.
Right now the VIX is down at $12.
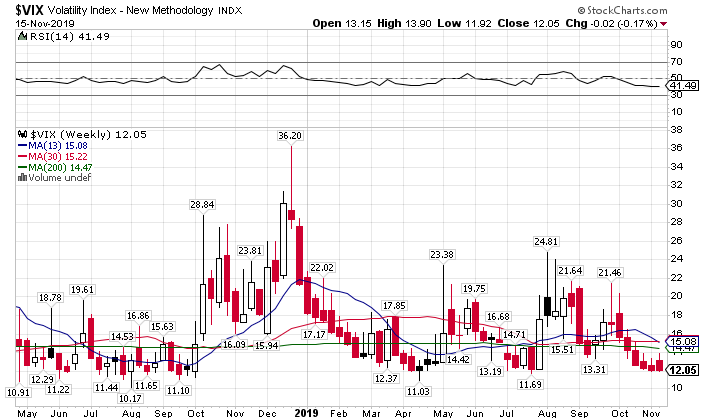
VIX weekly chart
The VIX hasn’t reached $14 in over 3 weeks. That’s extremely rare. It doesn’t mean that it will hit it this week. But, the VVIX thinks it might.
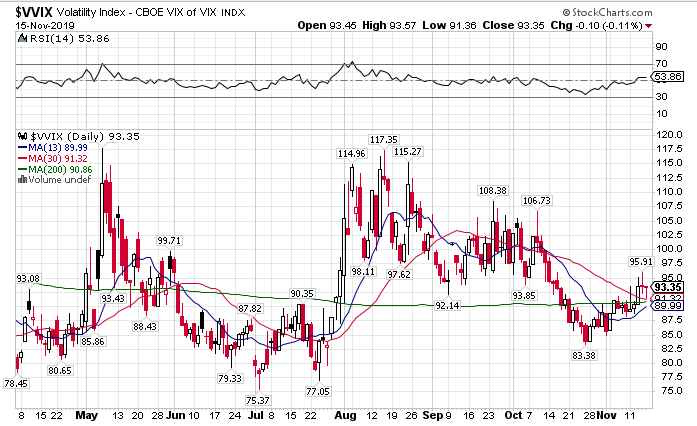
VVIX weekly chart
Option traders say they expect volatility to return soon. And why wouldn’t they? There’s been little volume on this recent run in the markets. We’d except that that conviction would mean more than 50 million daily shares traded in the SPY.
The dollar could give us the timing signal
Normally the dollar and stocks trade in opposite directions. This year they decided to dance the same tune. Only recently has the dollar pulled back meaningfully.
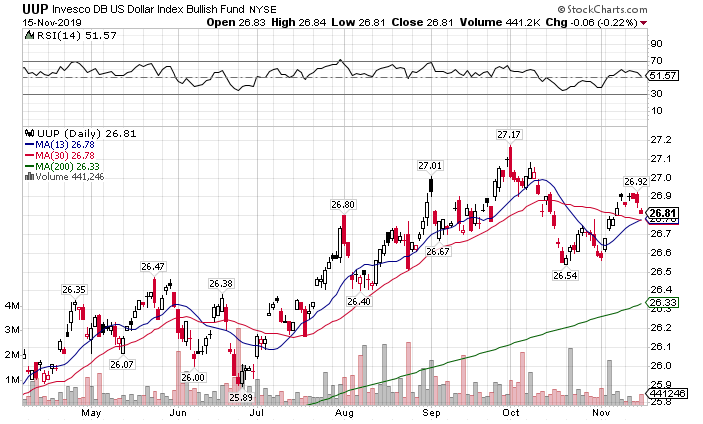
UUP daily chart
I’m watching this potential moving average crossover. It looks like that will mark an important time in the market. That should also see the dollar find support at those moving averages as well.
Oil will break out to the upside
Crude wants to turn a corner technically and fundamentally. With a nice consolidation pattern forming, I expect it might want to run past $60 a barrel, which could really boost energy stocks.
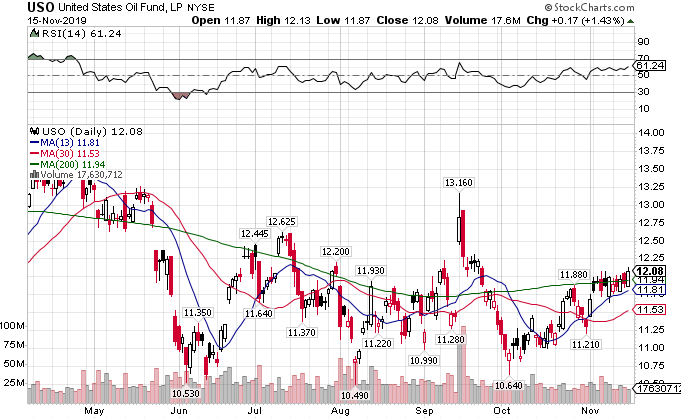
USO daily chart
There’s a lot of options, but only one way to play
Markets always pull back. It’s just a matter of when. It could be tomorrow, it could be next week. Until then I trade the same way that’s paid me well for nearly two decades.
If you’re ready to take your trading up a notch, then come join me at Total Alpha.
