Before I jump into today’s topic of moving averages. Let’s pause a second and take a deep breathe, inhale, and then exhale.
Does the air feel different, now that the market has smashed through all-time highs?
And where do we go from here?
When it comes to my trade entries and exits, as well as, targets—I’ll use moving averages for guidance.
Just this last week, I made $50,000 off a moving average setup in Total Alpha!
No matter how you trade the markets, moving averages need to be a part of every trader’s toolbox.
And it’s not just traders who use them. Large funds determine their equity exposure based on daily and weekly moving averages.
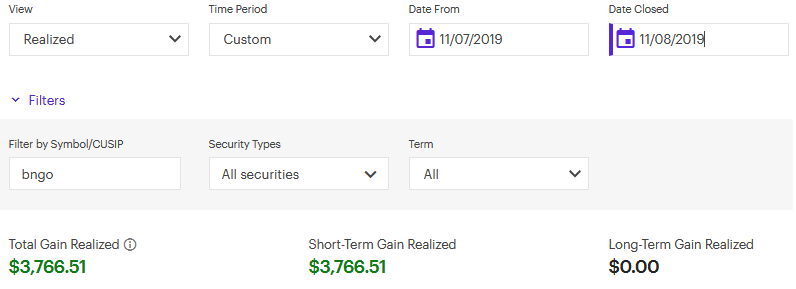
Penny Stock Pro Jeff Williams launched a Supernova trade, relying on moving averages to knock off $3,766 in less than 24 hours!
It may seem odd a big stock options trader and a penny stock day trader would have much in common. But let me show you how two completely different strategies leverage moving averages to turn profits.
Moving average basics
There aren’t too many things that cross disciplines. Generally, day traders employ different techniques than swing traders. Large funds rarely look at any technical indicators.
Yet, moving averages make their way into nearly every analysis for every account. It’s not hard to see why once you understand them.
Moving averages calculate the average price across a defined number of time periods. Simple moving averages treat each time period equally.
Our discussion will center around simple moving averages (SMA) that calculate off closing prices. You can read more about moving averages in my free article ‘How to use technical analysis MA Basics’
Here’s a quick example. Say the closing price for a stock is $10. The next day it’s $15, and the third day it’s $20. The 3-day moving average would be $10 + $15 + $20 = $45 / 3 = $15.
Longer moving averages take more time to turn. But they also remove a lot of noise. Conversely, shorter-term moving averages respond quicker to price changes.
Here’s an hourly chart of GLD. The red line is the 200-period moving average and the blue line is the 10-period moving average.
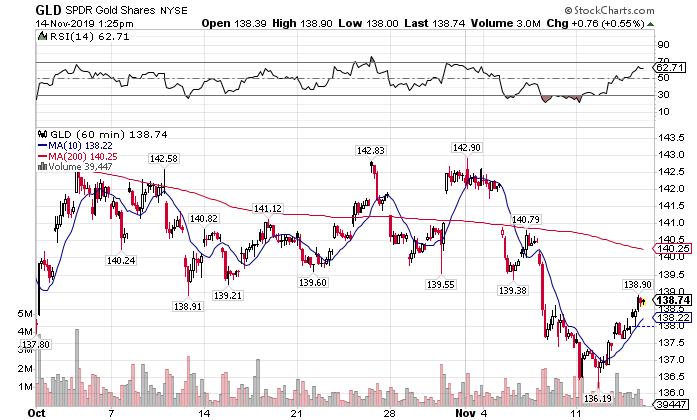
GLD hourly chart
The shorter time-frame moving average jumps around a lot, while the longer-term moving average gradually slopes lower.
That’s why traders and investors look to longer-term moving averages to determine trends. Plus, when you look at the price action relative to those moving averages, you get a sense of its strength.
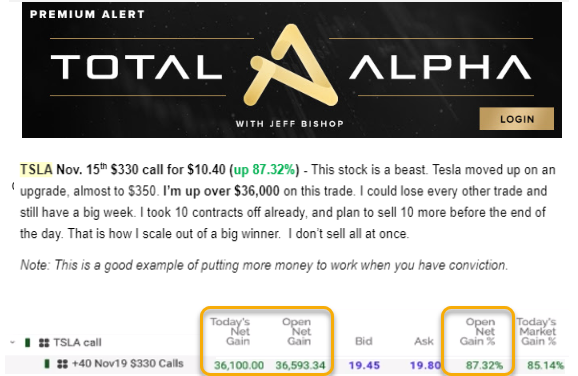
How I turned a profit of $36,000 using moving averages
Tesla (TSLA) blasted off from earnings, jumping over 30% overnight. The stock opened up around $300 and moved towards $340 in a matter of days.
After retracing, I saw the 13-period moving average cross below the 30-period moving average. This signals to me that the short-term momentum shifted lower. But, the stock continued to hold the level.
Over the next several trading sessions, Tesla traded sideways, with the moving averages crossing over one another constantly. Then I noticed the 30-period moving average start to turn upwards at the beginning of November.
Check out the box in the hourly chart below.
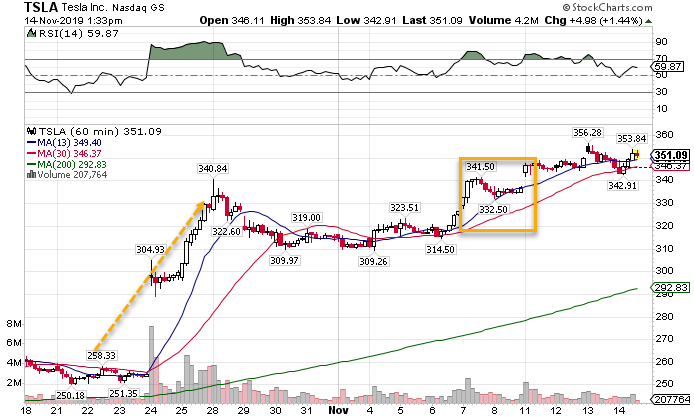
TSLA hourly chart
Price pushed past the previous high of $340.84. Then it pulled back into the short-term moving average before trading sideways. This keyed me into a consolidation pattern on top of the moving average.
Let’s review what I had:
- Longer-term 30-period moving average turned upwards
- The stock broke the previous high
- It then made a consolidation pattern
- That pattern rode the 13-period moving average
With so many components working in my favor I took an aggressive stance that paid off nicely.
Penny Stock Payoff using moving averages
Jeff Williams Supernova trade shows how a completely different style trader works similar concepts. He saw a setup using the 50-period moving average that let him make a big profit overnight.
Penny stocks sometimes take months before they make a move. It requires a lot of patience but pays big dividends. I tip my hat because I’ve never been able to do it consistently.
Bionano Genomics (BNGO) had been on Jeff’s radar for a while. At the end of the day, he noticed the stock broke and stayed above the 50-period moving average.
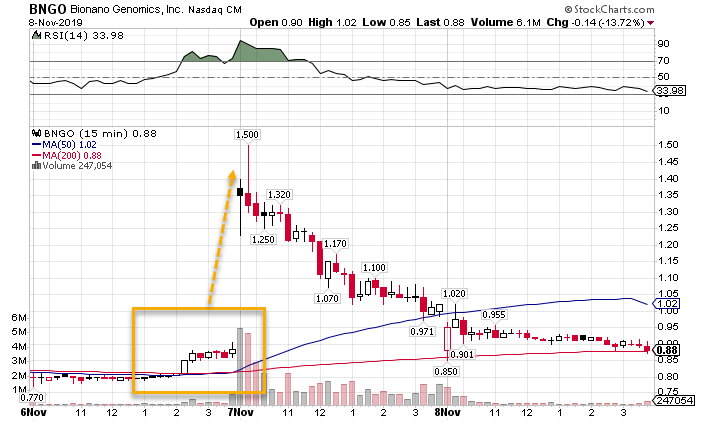
BNGO 15-minute chart
Notice a familiar chart pattern here? He had a nice consolidation on the heels of price, showing a lot of strength. Jeff took an entry at $0.87 and exited the next day at $1.40.
That’s a 61% gain overnight!
That’s the power of moving averages. They work not just as support and resistance levels, but timing signals as well. You’re missing out if you don’t incorporate them into your trading and investing.
And don’t miss out on the chance to take the small account challenge with Jeff Williams. This guy takes accounts as low as $3,000 and turns them into $25,000 regularly.
Find out how he does it in Supernova Trading.
