Oil topped out in 2008 at… get this… $147 a barrel!
However, it has seen triple digits in almost seven years—today WTI crude sits at an anemic $57 per barrel.
We can thank technological innovations and a total disrespect of our planet for cheap gas prices.
New production popped up in the most unlikely places…
Drilling technology opened up reserves across the U.S., vastly increasing output.
We’ve seen a flood of U.S. shale barrels hit the market… and The Organization of the Petroleum Exporting Countries (OPEC) cut estimates for its crude production over the next five years.
The dramatic shift in supply permanently cratered prices across the globe before… and it could happen again.
In fact, the highest Crude got since the crash back in 2014 was last year at $78.73.
Countries that relied on oil revenues faced political upheavals.
So, a rally from the October lows of $51 to $57 seems rather small in context…
But does it signal something bigger or is this just another suckers rally?
Could Crude Oil and Natural Gas Break Out?
First, let’s start with the obvious.
Energy prices were way oversold. Both Crude Oil and Natural Gas sat near record lows.
Although Crude didn’t go nearly as low as it did in the winter of 2018, price remained extremely depressed.
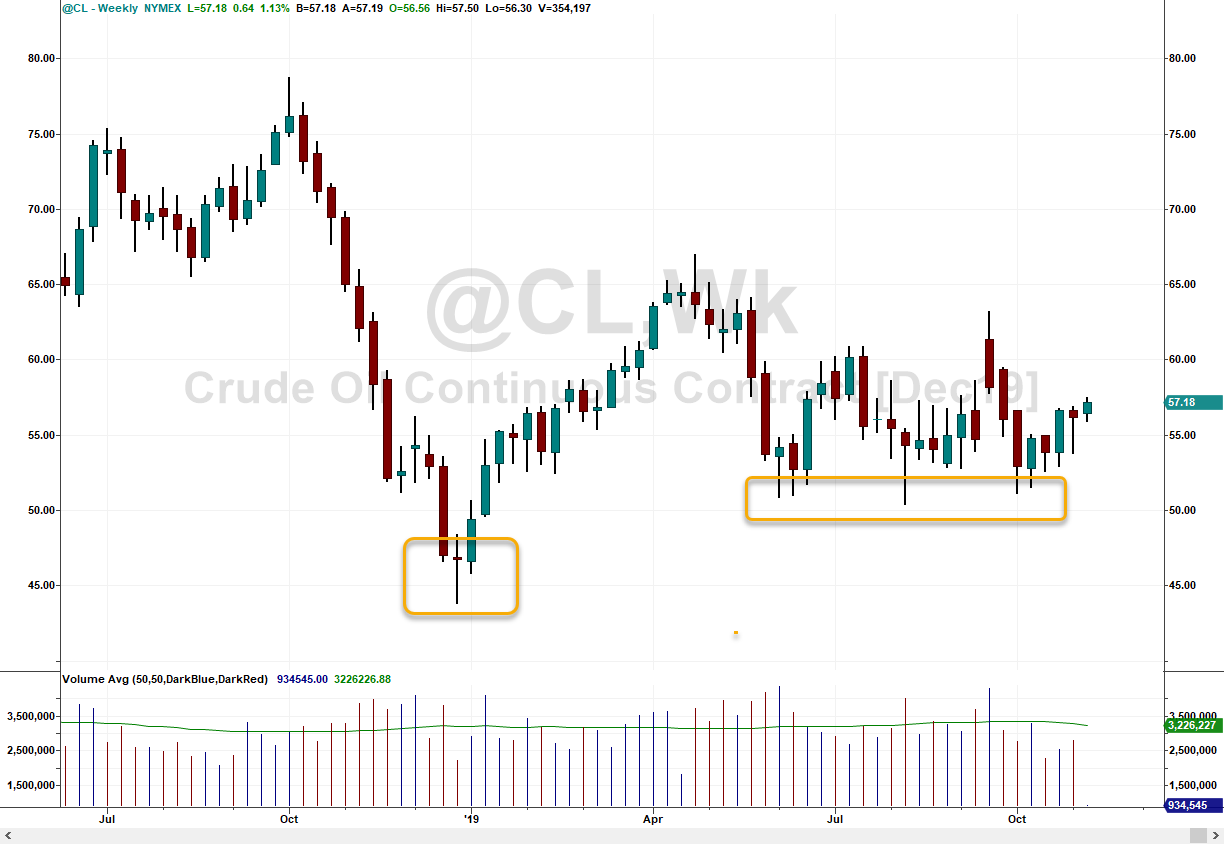
Crude Oil daily chart
Crude found a lot of support around $50 a barrel since early summer.
News hit the wire in the later months of an attack on Saudi Oil fields that demolished production.
Yet, at the time, while price jumped almost 15% overnight, the Oil VIX spiked as well.
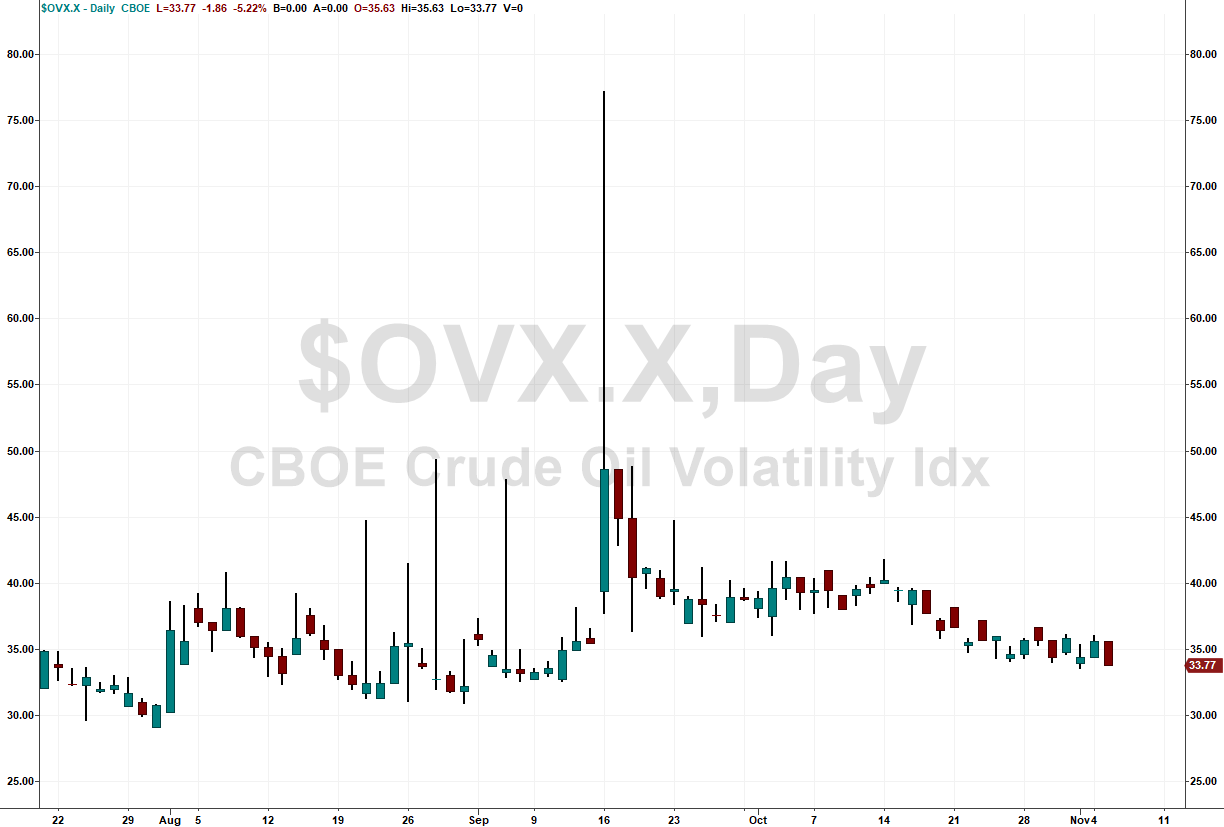
Oil VIX daily chart
So crude spiked and traders were pricing in a big move.
That tends to mean they expected price to drop pretty fast.
Why is that?
Well, if crude spikes on a production loss, the disruption lasts only a certain amount of time.
In fact, Saudi Arabia expected to have most of the production back on by that weekend.
Put these together, and you have a recipe for falling oil prices.
Today we have a different story.
Oil prices have not only climbed, but they’ve also brought along some long-forgotten sectors.
The S&P Energy ETF (XLE) climbed a whopping 10% off the October lows. That’s better than the SPY 8% increase.
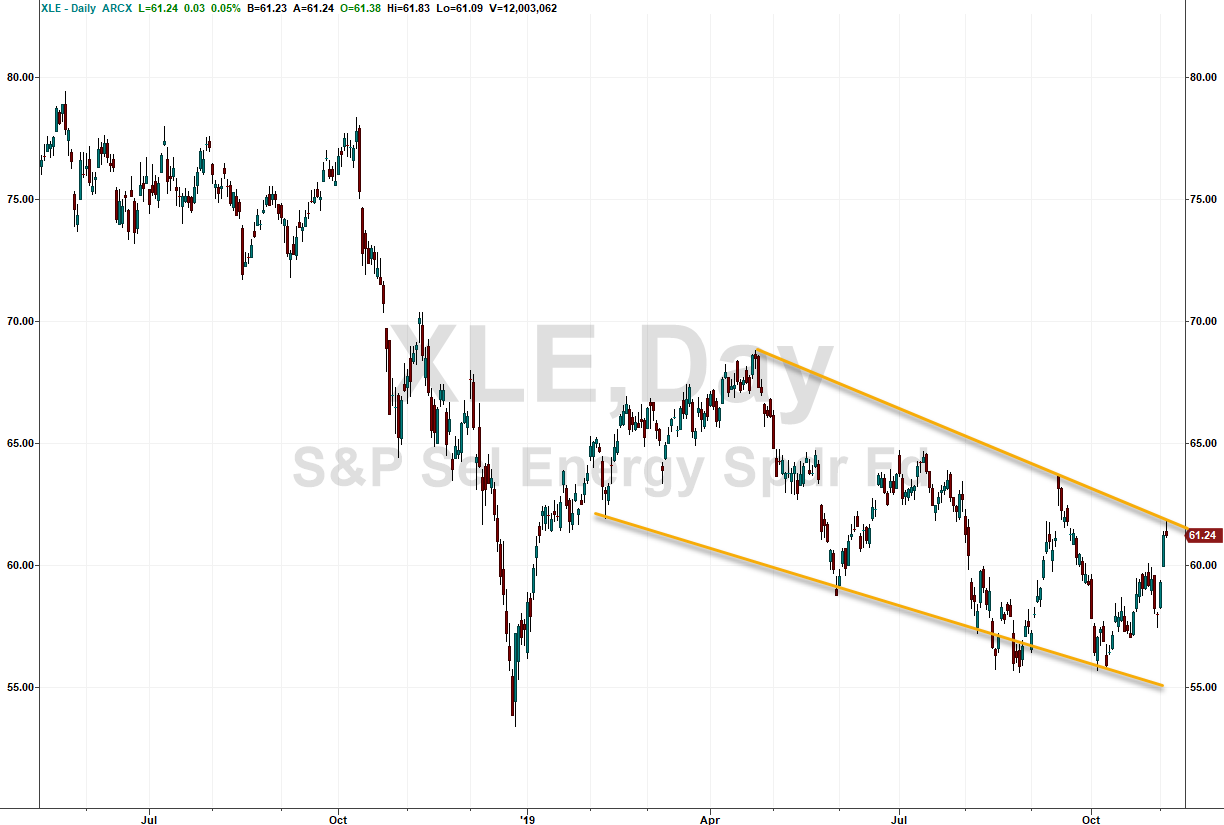
XLE daily chart
Energy hasn’t just lagged the markets, it’s in a different continent altogether.
It’s actually been a bit of a surprise that more shale drillers haven’t gone bankrupt, given the depression in prices.
Another interesting point comes from the Oil & Gas Exploration companies. The S&P ETF XOP tracks a basked of these companies including Marathon Petroleum (MPC), Murphy Oil (MUR), Apache (APA), and others.
While the XLE remains well above the lows of the last several years, the XOP appears to be rising off the bottom.
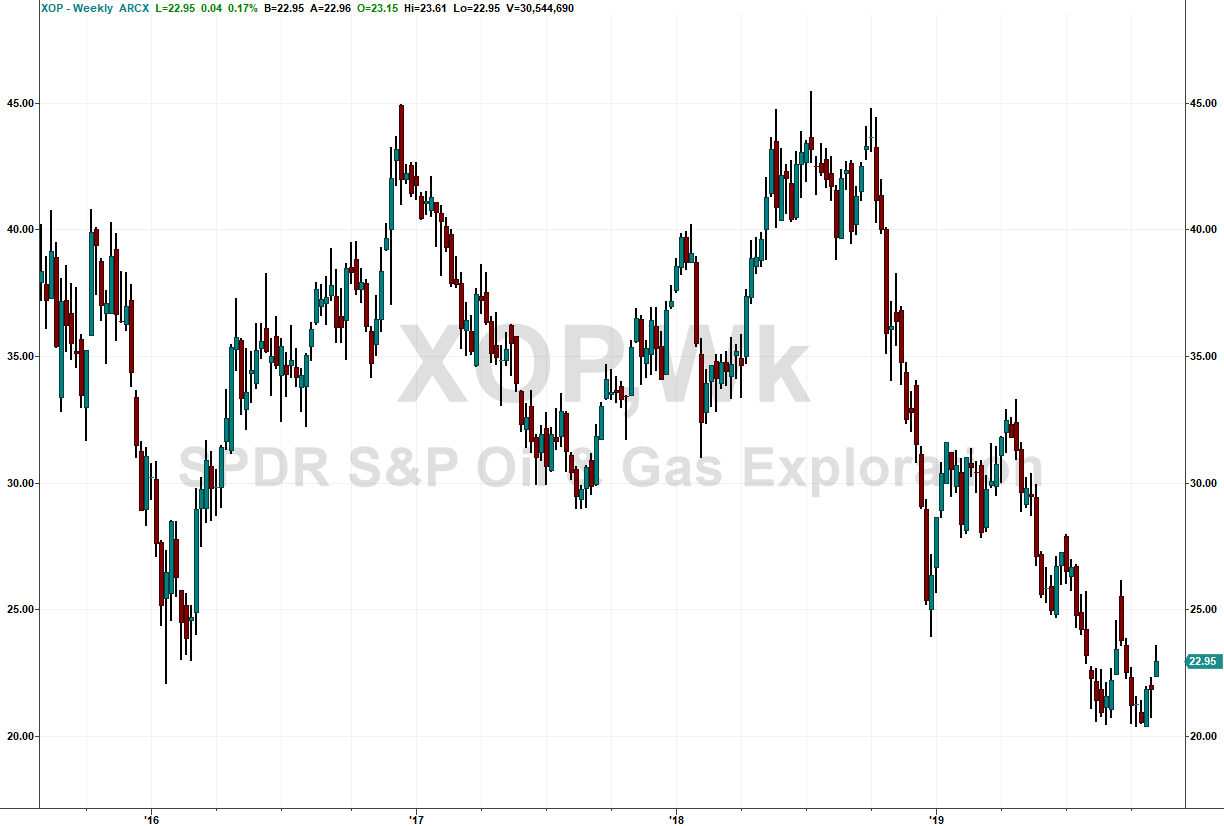
XOP weekly chart
Nothing has fundamentally changed yet in the production landscape. However, these stocks were up nearly double their current value at the end of 2018.
Even a measurable increase in oil and natural gas prices could send these stocks soaring.
And natural gas doesn’t look too shabby at the moment.
Known as the ‘widow maker,’ natural gas follows some well known seasonal patterns.
Yet, the recent surge in price comes on the heels of an extremely odd winter.
Parts of the southeastern U.S. remain at record highs, while extreme cold grips other parts of the nation.
This created an unusually high burn of energy and fuel consumption.
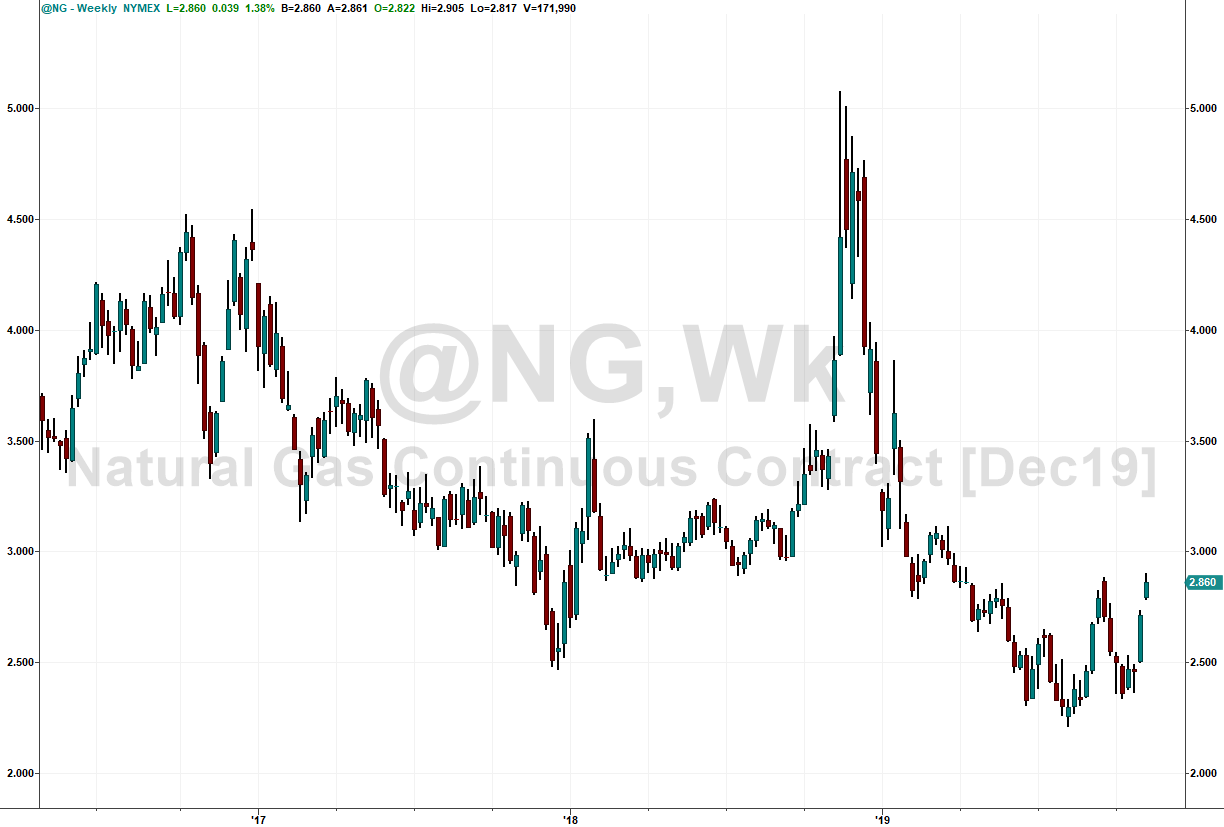
Natural Gas weekly chart
Natural gas experiences wild swings in prices regularly. Last winter price shot up from $3 to $5 in a matter of days.
Current prices remain below prior years and are coming off of already depressed levels.
My take
This appears to be nothing more than a sucker’s rally in the short-term. We could easily see natural gas prices explode higher on short-covering or other technical factors.
Yet, time and again as prices rise, production increases to match. The same thing occurs with crude oil.
That dynamic hasn’t changed for years and shows no signs of deviating.
That said, the XOP ETF looks enticing here. The $20 level offers a great stop to work with.
Fundamentals don’t need to change for the ETF to double from here. It could do that entirely on the back of a renewed economic outlook.
Given that I’m not seeing heating oil prices rise, I don’t know that we aren’t being fed an excuse to match the price action.
I won’t sit here and say that crude prices could run up towards $64.
But, I think there are plenty of better opportunities out there to trade.
I’d rather put my capital to work on setups I know work out.
That’s why I grabbed an opportunity in SDC the other week.
The stock signaled it bottomed, giving me a chance to put on some call options.
$22,962 later, I’m a happy man.

If you want to learn how to spot trades like these, come join me at Total Alpha.
It’s one of the best places to learn an array of trades to fit your needs and style.
