The Federal Reserve’s well-choreographed magic show pushed the stock market to new all-time highs.
Market pundits were quick to congratulate the Fed on a job well done (pretending as the interest-rate cut was an actual choice the had.)
As I sat through the verbal vomit they spewed, I couldn’t stand it anymore!
Not a single one of them was a trader.
Otherwise, they wouldn’t miss the obvious clues in the market.
They preferred mental gymnastics to keep you from the truth.
While the “plunge protection team” may have scored a win this week… I want to share with you what they didn’t talk about and, to be honest, it concerns me. If you’re an active trader or someone who jumps in the market from time to time then you’ll want to read this.
Where’d all my friends go?
Let’s start with the obvious…no volume.
The SPY traded a whopping 49 million shares against a 90-day average of 64 million.
Talk about conviction….
Heck, look at the S&P 500 futures.
Since 2010, the average amount of contracts traded during an FOMC day was 2.4 million. The volume this week came in at 1.1 million contracts, 50% below average.
In fact, volume has been dropping rapidly in the market as we moved towards these new highs.
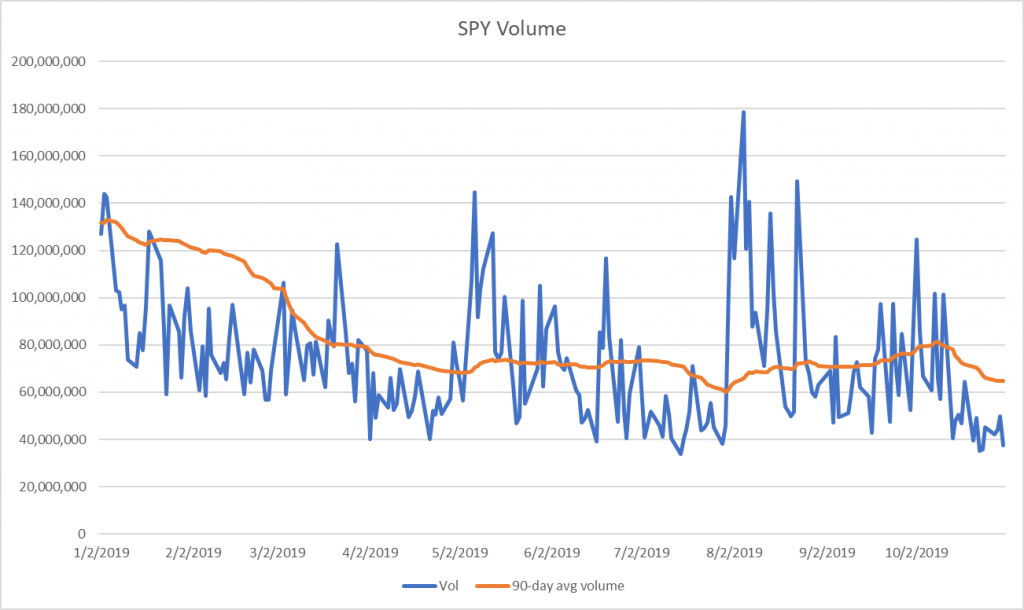
The lack of participation should worry anyone. Low volume means big money isn’t buying in.
We aren’t going to get another leg higher without participation from the heavy hitters.
But the other major indices also tell the story.
The IWM which represents small-caps finished lower on the day. It’s nowhere near the all-time highs.
They’re supposed to be the beneficiaries of the easy money greasing the system. So why can’t they get a date to the prom?
Then you get a decent selloff on Thursday in the markets with the SPY closing down 0.79% before finishing the day down 0.27%
All thanks to a market pinning their hopes on AAPL saving their hides.
Tim doesn’t care about you
AAPL’s performance on ‘good’ earnings pretty much sums it up. The stock spiked higher in the after-hours to sweep the previous highs.
It didn’t take long before it landed back in reality.
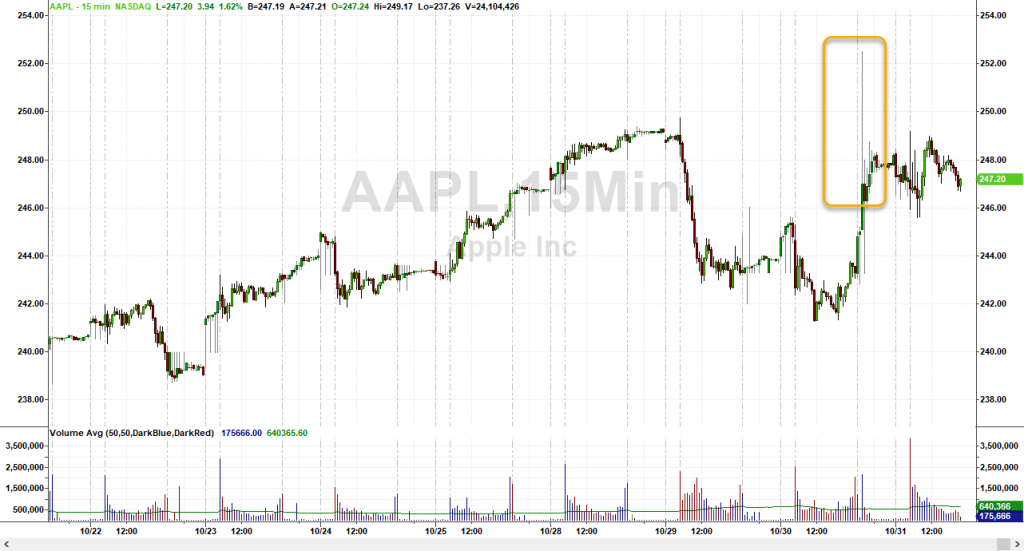
AAPL 15-minute chart with pre & post-market
AAPL was the last bastion for the major indices.
AMZN already reported pretty lousy numbers and took the hit for it. MSFT knocked it out of the park but got very little love.
At some point, investors and traders will unwind their positions in these stocks. That should start a swift decline in stocks.
Remember, last year we had the indices crater through Christmas like some Bob Cratchet on steroids?
Back then traders took their money and plowed it into safety trades… just like they’re doing now.
What the media gave all of 10 seconds of coverage
Safety trades told the real story here.
Gold initially sold off but quickly recovered by the end of the day finishing near the session highs.
The push higher the following day says more about what investors think than the reaction five minutes after the announcement.
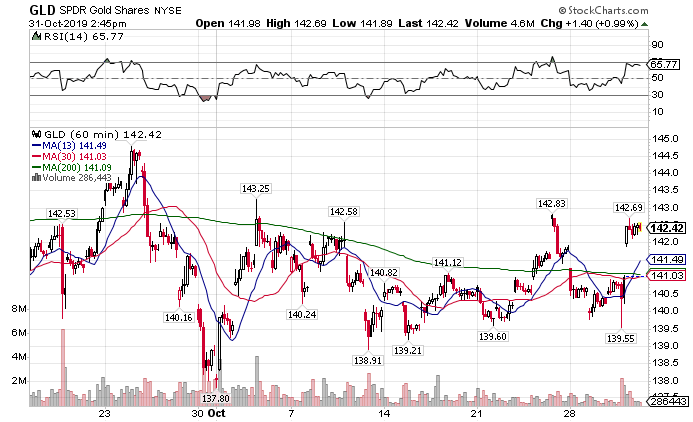
GLD hourly chart
Gold has traded sideways since its last push higher in early August.
If investors really thought stocks were going higher, they’d be cashing in these positions. I don’t see any of that.
In the same breath, bonds decided they liked what the Fed said and resumed their march higher. The TLT didn’t even make it down to the recent swing low.
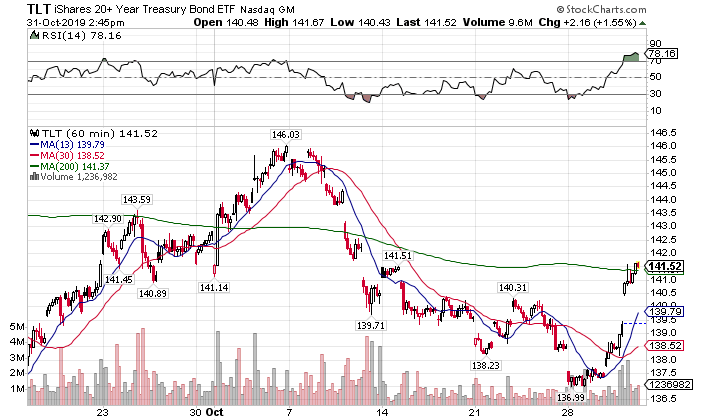
TLT hourly chart
If traders are willing to throw their money at an asset that record levels, they either hate all the alternatives, think some sucker will buy it even higher, or both.
What I found most intriguing was the movement of the U.S. dollar. That alone stood as an outlier to this jumbled mess.
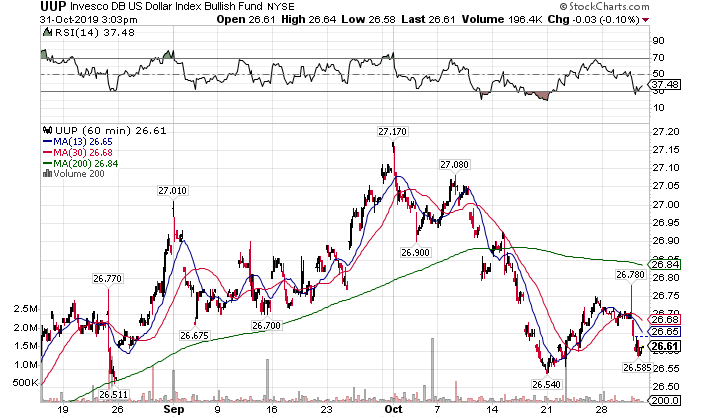
UUP daily chart
Up until now, the dollar traded higher with stocks. This was the first time the two really diverged.
That being said, the dollar did continue to decline the day after along with stocks. It’s entirely possible those traders had to unwind their positions for one reason or another.
Still, it’s an area that I’ll be watching for clues about the future.
You want to know how to win in this environment?
Ohh that’s easy.
Pick the best and ditch the rest.
SDC is a newer IPO that sold off heavily from its recent debut.
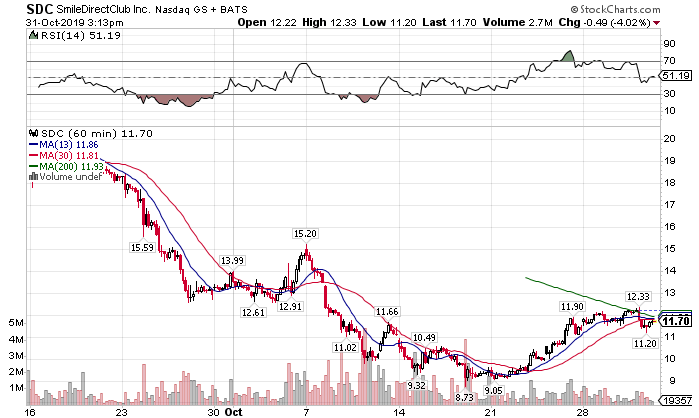
SDC hourly chart
The stock came into a round number of $10.
Pro Tip: Big numbers tend to attract orders, probably because people are lazy.
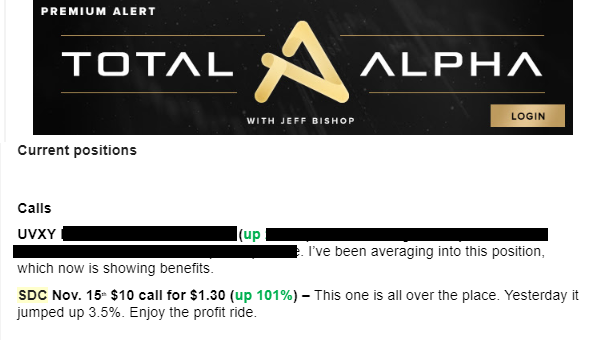
I got a money pattern crossover near the level that looked enticing. The risk-reward set up nicely, especially using options to limit my risk.
Total Alpha members watched me ride the wave as this trade turned over 100%.
It comes down to finding stocks with the right opportunities at the right time. That doesn’t always mean trading momentum plays.
It means finding the best trade setups for that situation.
If you’re ready to experience the Full Monty of trading, then come join me at Total Alpha.
