Want to see something spooky?
Here’s last month’s Intermarket analysis report.
I could literally copy the main points and they’d still apply today.
Will history repeat itself?
Or will the Fed’s Powell grow a pair… and really tell us what’s going on with the economy?
Yes, this week, we’re all witnesses to the Fed’s dog and pony show. A shameless parade—as if their interest rate decision harbors any independence.
Yet with the market pricing in a 93% chance of a 25 basis point cut, who is leading who?
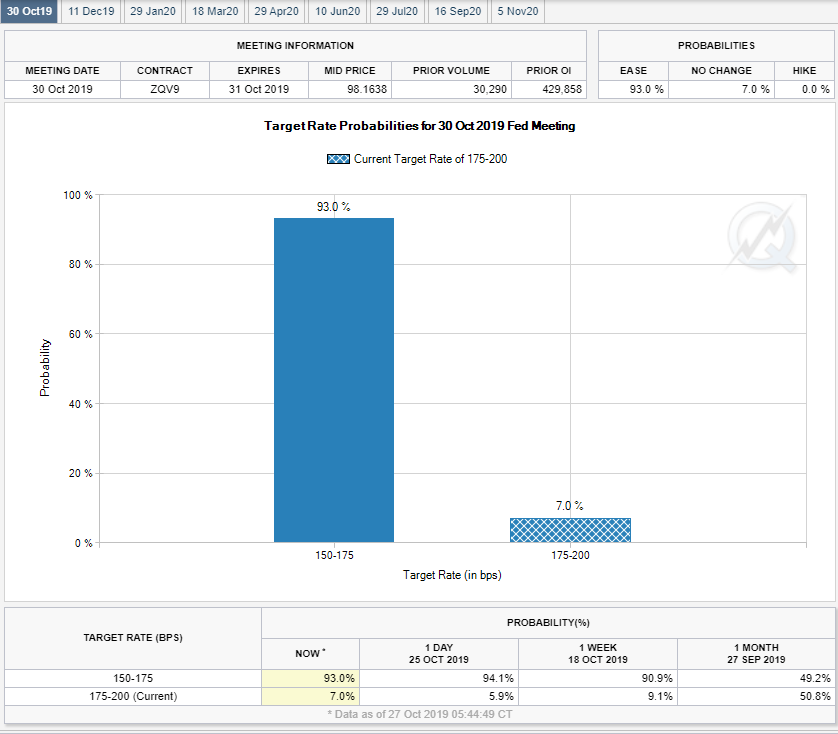
There’s no shortage of headlines making the rounds…some even calling for the U.S. to join the world in the race to the ‘negativitiest’ rate.
Yes, that word doesn’t exist, but neither should negative interest rates!
Politicos to economists continue to push the notion that we need free money to combat a global slowdown.
Yet, even members of the dovish ECB recently showed skepticism. They questioned the real moral hazard bubble expanding around the world.
Honestly, if they want to pull their interest rate pants down in front of the world, go right ahead. It’s exactly why I trade the markets.
They want to create uncertainty?
BRING IT ON!
I chew up volatility and spit out winners like a pro.
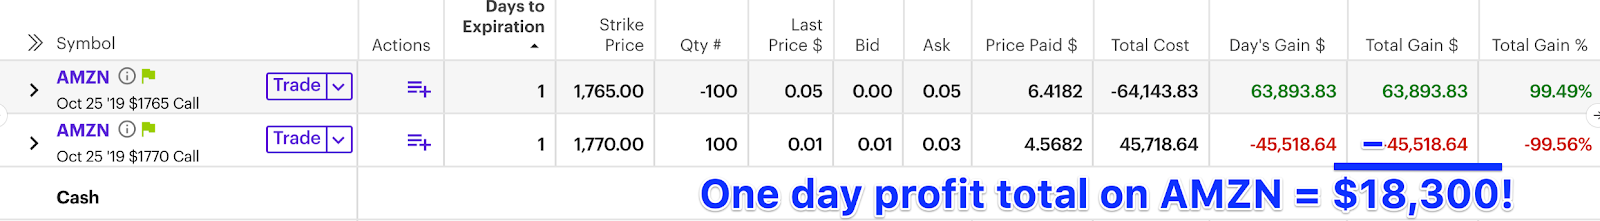
Amazon earnings?
I’ve got 18,300 reasons to love ‘em.
We will see new highs
Don’t act like you’re surprised. This is happening. Brace yourselves and put on your party pants.
The SPY came within a whisper of all-time highs.
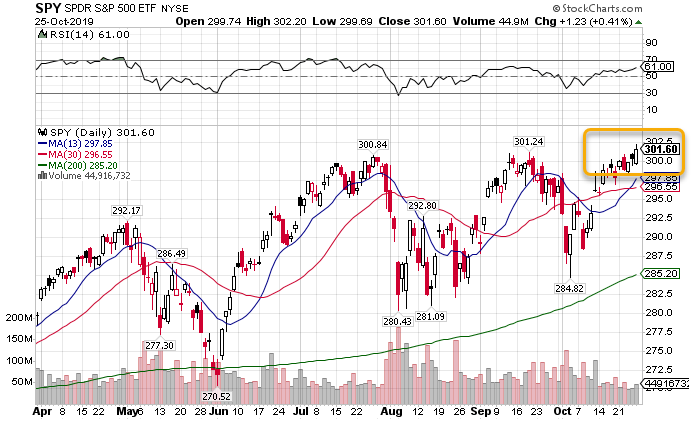
SPY daily chart
Friday’s high was $302.20. Target – $302.63.
Markets tend to float upward into Fed announcements. It’s actually so common that quants studied and published findings on this phenomenon.
The QQQ already made new all-time highs Friday at $195.74.
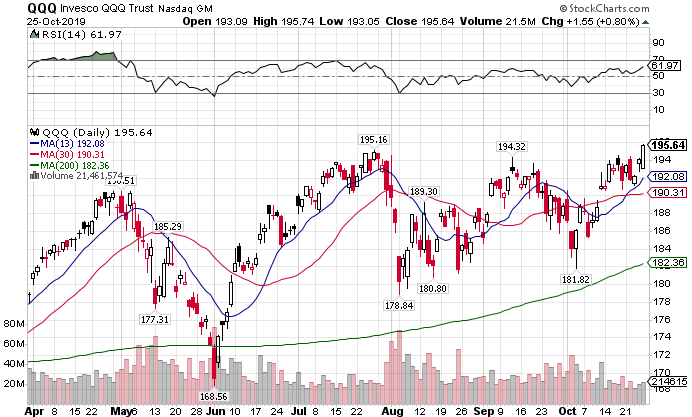
QQQ daily chart
They tell us global demand remains soft…and yet the semiconductor index continues to ride in its hot air balloon.
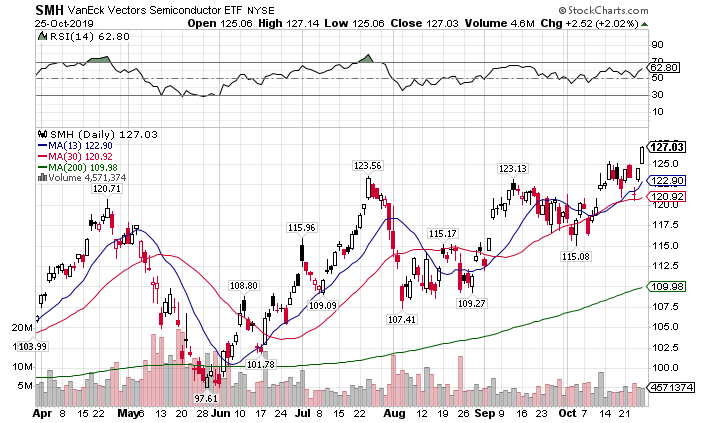
SMH daily chart
Ohh yes, tell me again how there’s an oversupply in the chip market… that the trade wars crippled demand.
How’s this possible given a landfill of traders dumped Amazon last week?
AAPL
The stock may only make up 3.84% of the index. Yet, it’s returned nearly 75% year-to-date excluding dividends, 3x the SPY.
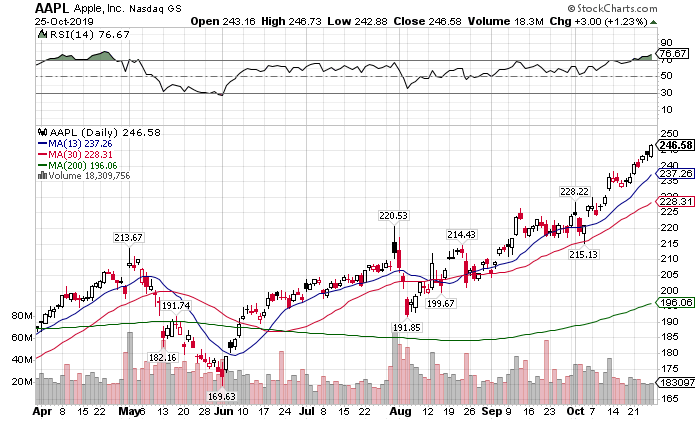
With their earnings coming up October 30th, we might as well break out the popcorn…
Cause this is going to be a wild week!
Bonds take a backseat
Nearly a month later we stare at treasuries in an identical location. Last month was the first time we really saw a true pullback in bonds.
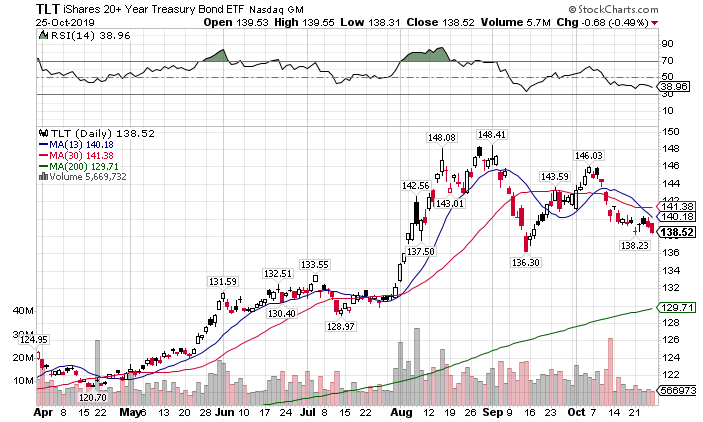
TLT daily chart
With my money-pattern setup here, I expect bonds will sell off this week. However, they can still go all the way down to the 200-day moving average and remain in an uptrend.
But the dollar refuses to play ball
Dare I say, maybe investors might see a bubble in bonds? What else would explain the sell-off in the ‘safety’ play, but the continued bullishness in the U.S. dollar?
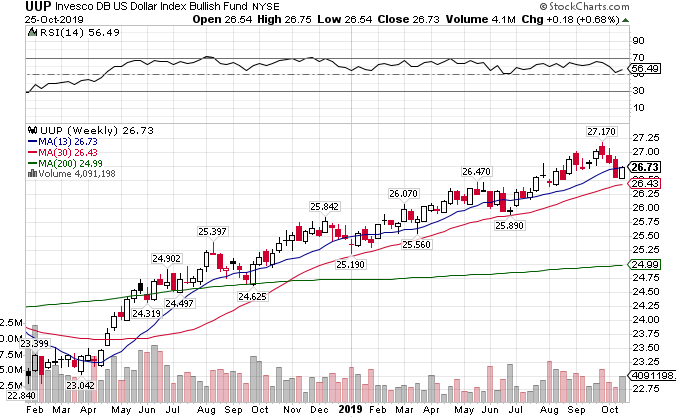
UUP weekly chart
Even gold remains in vogue for traders.
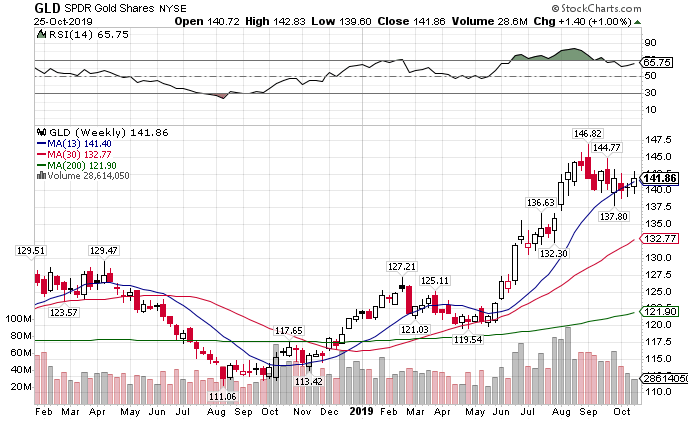
GLD weekly chart
Tell me Jeff what does this mean?
Don’t worry baby birds, I’ll feed you.
Let’s do a thought experiment. Imagine you are the algorithms for the big banks. You want to get short the market. How would you do it?
Try going short now and you’ll send the market into a tailspin. The fragility underpinning the major markets would break open in a tick.
But what if you could get everyone to think the market’s going higher? Now there’s a sneaky deeky idea.
If you’re a trader short the market, where do you have your stops?
Right above the old highs seems like a good bet.
The big money needs to engineer liquidity (people to buy their shorts), without showing their hand. How do they do that?
Simple, trip all the stop orders. When the market breaches old highs you’ll see a lot of volume hit as shorts cover. That’s where the big money steps in to get short.
This isn’t something that happens in minutes necessarily. It could last several days and a few dollars in the SPY.
My sense is we’ll see the market trade up and through the old highs in the SPY this week off the Fed announcement and AAPL earnings. That is all a head fake.
What you need to focus on is data. We have a buffet of data points coming out this week.
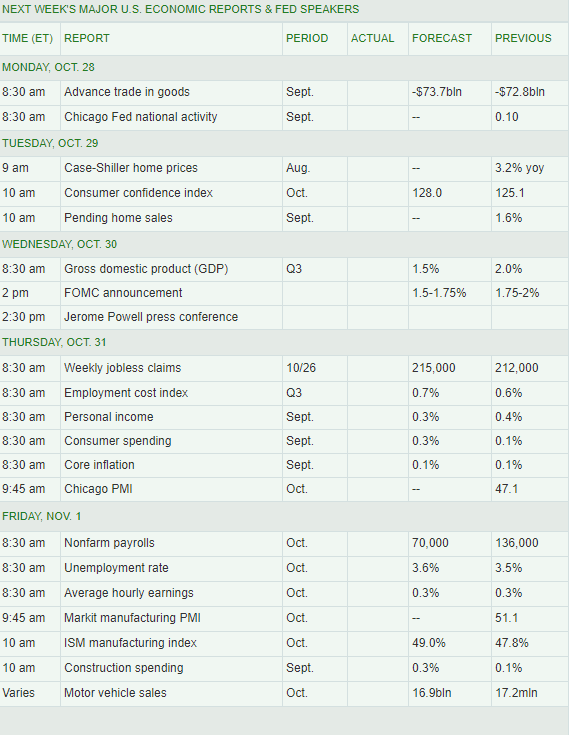
Rather than follow the sheep, focus on the following:
- Case Shiller home prices & pending home sales – Is the housing market contracting?
- Personal income, consumer spending, inflation and PMI – Could the Fed face a recession and inflation? That would suck big time.
- ISM and construction – We will move off the bottom, or is manufacturing in the toilet?
Take your trading from Beta Max to Total Alpha
It’s time to drop the Discman and strap on the big kid’s seat belt.
Quit trading the market that they want you to believe…this happy go lucky place where everything is pixy dust and puppy dogs.
The market is a brutal place that plays games with your mind and your money.
Break free from the shackles of the big money.
Trade the market the Total Alpha way.
Make trades like this…

Your reality.
