No other single trade makes you money faster than selling options.
It’s not just the speed, but the consistency to produce winners that makes it one of the most appealing option strategies.
I know you can trade options in a lot of ways but I dare you to find something as good as this…
When you trade stocks you only have one way to make money (stock rises if you are long or it declines if you are short)—you give yourself upwards to three different ways to profit when you sell options.
I call it stacking the odds in your favor. And when you combine my “money pattern” with it, it’s pretty much unbeatable—hitting win rates as high as 70-80%.
Imagine putting yourself in the driver’s seat and having complete control of your trading.
However, selling options isn’t for everyone… and if you miss a step… it can be extremely costly.
But all of that can be avoided, and I’ll teach you the proper way to sell options, a way to maximize your profits while reducing your risk exposure.
Learn to sell option spreads
Option sellers hold an advantage over buyers. Think of options like insurance. No company would sell insurance at a loss. The same holds true for options. And just like insurers, selling options delivers a consistent stream of wins.
But let me first explain how selling basic option spreads work.
Option spreads come in two versions – put spreads and call spreads. The goal is to have the stock close below the lowest strike price for calls and above the highest strike price for puts at expiration. This lets the options expire worthless, and you keep the credit you received.
Here’s how to construct an option spread.
First, you sell an option contract that’s out-of-the-money at a strike price. At the same time, you buy the same number of contracts at a strike price that’s further out of the money with the same expiration.
Example:
- XOP trades at $40.I sell 5 Call option contracts at a $45 strike price for $1.50 expiring in one month.
I buy 5 Call option contracts at a $47 strike price for $0.75 expiring in one month. - XOP trades at $40.
I sell 5 Put option contracts at a $35 strike price for $1.50 expiring in one month.
I buy 5 Put option contracts at a $33 strike price for $0.75 expiring in one month.
These trades pay you a credit… the difference between the price you sell the options contract and buy the other one.
In this example, you receive $1.50, and you pay $0.75. Your credit is $1.50 – $0.75 = $0.75.
This is the maximum amount you can make for this trade. So, your maximum profit in a spread is:
Maximum spread trade profit = Credit you receive for selling the closer strike option – The debit you pay for buying the further strike option.
Now, let’s talk about your maximum loss. The option contract you buy caps the downside at that strike price. That means you can only lose the difference between the strike prices.
So how does that work?
In the example, you got paid $0.75. You get to keep that money no matter what.
The total amount you could lose is $46.00-$47.00 = $2.00 (which is the same for the puts). That makes your total possible loss $2.00 – $0.75 = $1.25 per option spread.
Your maximum loss on a spread would be:
Maximum loss = Distance between strikes – Credit received
Use the charts as your guide
I’ve made selling option spreads at key levels in charts my bread and butter. It combines two components that work in my favor: technical analysis and option decay.
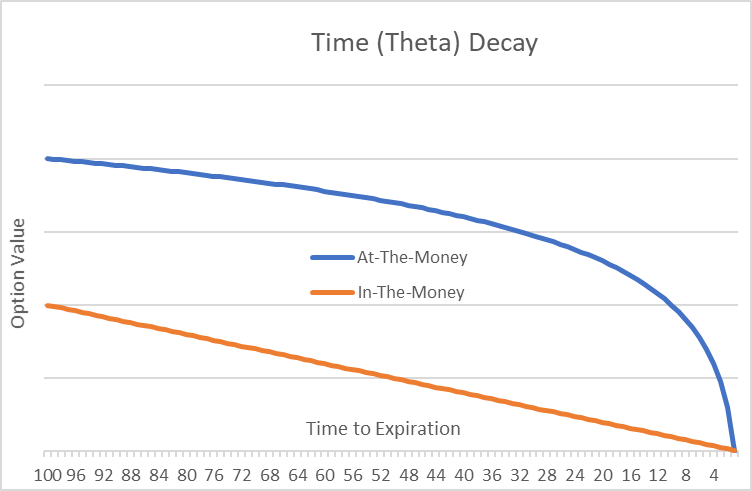
Decay works for options sellers and against buyers. Options will lose their value at an exponential rate as they approach expiration.
Here’s a graph to help you visualize how this plays out.
Then, I use chart analysis to find setups with a high probability of success.
One of my favorites – a crossover of the 13 and 30-period moving averages. NFLX shows a great example of this at work.
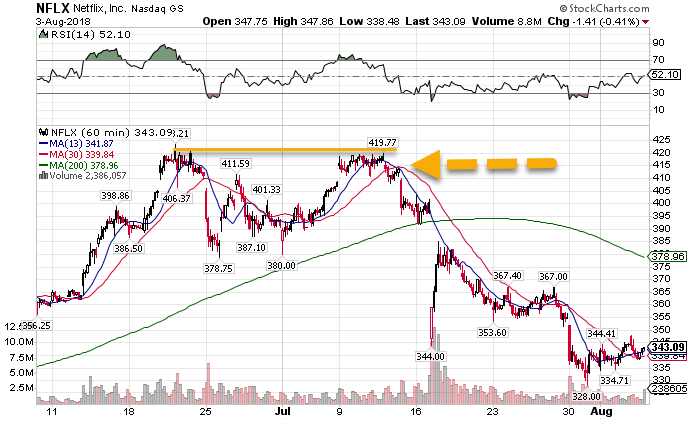
NFLX hourly chart
First, we have the moving average cross over. This lets me know the trend is changing to bearish.
Second, the trend is changing near a key resistance level. Notice how the stock couldn’t seem to get above ~$420.
I want to use these triggers to sell a call spread just above the resistance line. That gives me the most bang for my buck. Since I’m looking at the hourly chart I only want to go out a week or two with the expiration.
You can see how the stock traded lower over the next several weeks. This let me pocket the credit I received on the trade.
Create the right risk to reward
Balancing your risk and reward separates good traders from great traders.
Playing poker taught me to understand the relationship of bet sizing against possible outcomes.
Selling options has a much higher win rate than buying options. On my best days, I’ll win 40% of the trades where I buy options. I make up for this by getting big winners.
In fact, if you sold option spreads at one standard deviation (which is the range of price a stock will land 68% of the time) on the SPY every week, you would win well over 80% of the time. However, you wouldn’t win a whole lot.
The easiest way to understand this is through expected value.
Expected value tells you what you would make on the trade if you repeat it over and over. Every trade has a probability of success, not a guarantee.
You calculate the expected value as follows:
Expected value = (% chance of winning x potential profits) – (% chance of losing x potential losses)
Any value above 0 means you make money over time. Anything below 0 loses money.
Let’s look at the NFLX trade.
- Netflix traded at $415
- Selling $420 call going out one month would pay me $14
- Buying the $425 call would cost me $12 for the same expiration
Max possible profit = $12-$14 = $2
Max possible loss = $425-$420-$2 = $3
To break even (expected value equals 0) I need to win this trade 60% of the time. Anything above 60%, I make money.
You may not be able to figure out your chances of winning initially. Take some practice trades in a demo account to build up some stats. Use those to evaluate your trade’s potential.
