We’re told to ‘sell in May and go away’…
However, if you followed that advice, you would have missed out on the greatest bull months the market has ever seen.
But forget about last May, just look at the stats…
This table shows the win-rate and average gain or loss by month for the SPY for the last 20 years.
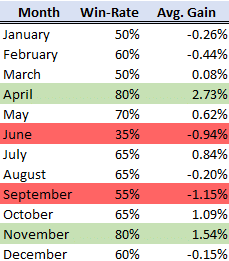
Test buys on the open of the month and sells at the close.
It makes you wonder…
How many other adages are we following which are simply not true?
I’m going to walk you through a series of tables like the one above.
Some of the stats you’ll see have the power to make someone A LOT of money…
Other ones are a COMPLETE waste of time.
What’s in a measure
Information is only as good as the measurements they take. When you change how much data you use, how you calculate it, or your assumptions, the results can vary wildly.
Look at what I wrote earlier about this information.
This table shows the win-rate and average gain or loss by month for the SPY for the last 20 years.

Test buys on the open of the month and sells at the close.
This data could be misleading for several reasons.
- I only used the last 20 years of data. Go back much further and the results change dramatically.
- My calculations use the open and close of the month. There’s missing data in between the close of one month and the open of the next that isn’t accounted for.
- The SPY isn’t the same thing as the market. It’s an ETF that pays dividends which alters the price.
If I corrected for the second issue I noted, the table would look like this:
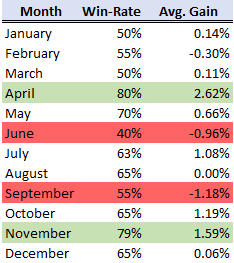
January turned from a negative month to a profitable one as did December. August managed to pull to breakeven, even with a high win-rate.
Here’s how I interpret this information.
For the ones with win-rates and low average gains, I ignore them. At best, the data suggests it’s a coin flip.
The truly negative and positive months, June, September, April, and November, I use as a starting point for my trades and broader market analysis.
What I find useful is performing this same type of analysis on a similar index like the small caps IWM.
Here are the second table calculations on the IWM.
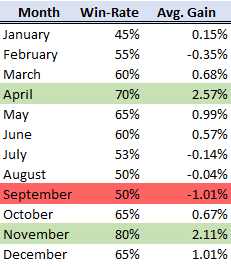
Interesting how June drops off as a negative month for the IWM. The other outliers show similar results.
Again, I would cut this down to those three months since I have two different stock indexes telling me similar things.
Extrapolating to other areas
Here’s where things can get pretty interesting.
Data like this can be cut a myriad of ways to come up with all sorts of useful statistics.
Here’s a look at the SPY on a quarterly level.
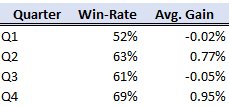
As you probably suspected, Q4 is a bullish quarter in general.
Can this work on the day of the week?
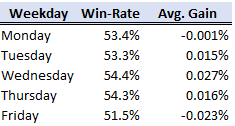
Using the SPY, we can see that Wednesday’s tend to be more bullish while Fridays are the least.
Bringing it together
There’s a lot of stats that can be used at any given time. Here’s how I tend to look at them.
First, I try to get a few different looks at whatever I’m doing. If it’s monthly biases, I want to see it on the IWM, DIA, SPY, and QQQ. Ideally, there should be overlap in one of the areas.
Next, I decide on the timeframe I want to use. The longer you go back, the more data moves to the average. However, it may not be as useful. For example, the market substantially changed in texture in the 1980s, and certainly over the last 10 years.
How much data you use is an important choice.
After that, I consider the statistics from various, unrelated angles. Taking a trade on a Wednesday in November would seem ideal. But, does it work out that way? I’d want to test that to see.
Remember, the more you limit your criteria, the less instances you get. That makes it tougher to come to a conclusion.
Lastly, I look at it compared to other markets. Bonds tend to rise when stocks fall. Historically, do they do well in certain months that stocks do poorly?
Even if they trade together in some months, that could be the Fed effect.
Ideally, I want to get several data points and average them together. It’s similar to how weather forecasters come up with their models. No single one is right, but the average is pretty accurate.
Total Alpha Masterclass
I know some of you are chomping at the bit to put your ideas into action.
Before you do, take a minute and join me for my upcoming Total Alpha Options Masterclass.
Here you’ll learn a set of techniques and skills I regularly use in my trading.
Click here to learn more about my Total Alpha Options Masterclass.
