I shared three trading ideas in a live training session for members a few days ago.
After letting them marinate…
I’ve decided to let them out of the box and share it with you.
In fact, I whipped up a video of the segment, highlighting the trade ideas for you to watch.
Not only do you get my top ideas, but I explain what I’m looking at in each of them.
Click here to watch my training video
In this video, there are a few key points I go over… which deserve your attention, including why I like the Gold Miners.
But before we get this party rolling… I want to also point out to you my approach to finding explosive breakout stocks.
The right way to find breakout trades
One of the first charts that I discuss in the training video is Inovio Pharmaceuticals (INO). Some people love the company. Others hate it.
Opinions aside, it’s the chart that I’m more interested in discussing. The stock highlights a common pattern known as a ‘consolidation.’
Consolidation patterns occur after a price makes a run either higher or lower and needs to rest. It’s like a runner taking a breather, going a little slower after climbing a hill.
Here’s how I find these using INO as an example.
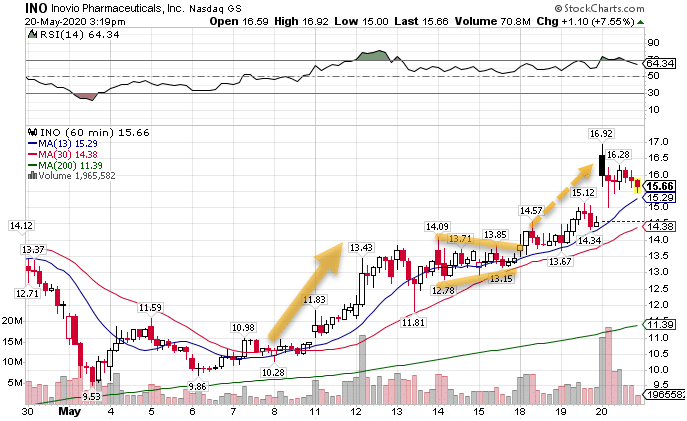
INO Hourly Chart
To start, I look for a sharp move out of a rangebound stock. Since I use the hourly chart, I generally want these to sit in the same price range for a couple of weeks.
In the INO chart, the solid orange arrow shows marks where price took off higher before finding resistance around $13.50.
Next, the orange trendlines connect the highs and lows of the candlesticks. See how they’re squeezing together? That’s the second part of a consolidation pattern.
When price needs a rest, it starts trading in a tighter range. Drawing trendlines helps me see this when I’m looking for a trade.
With the sharp move and the contracting price channel, I have the two main components of a consolidation pattern that I need. From there, it’s a matter of setting up the trade.
A good way I play this is using the high and low of the chart pattern range as my breakout targets and stops. If the stock closes below the low, which would have been around $12.78, I stop out. Otherwise, I’d look for a break above $14.09 as my target.
Leveraged gold plays
As I talked about in the video, gold tends to be a ‘safety’ trade for investors. With gold as a store of value for thousands of years, it has a history of being accepted everywhere.
Lately, the gold market continues to drive higher, even as stocks themselves do as well. It’s created an odd dynamic or both rise at the same time.
One way to play this that gives you a little extra bang for your buck is through the gold miners. But rather than trying to pick out individual companies, I prefer the GDX ETF.
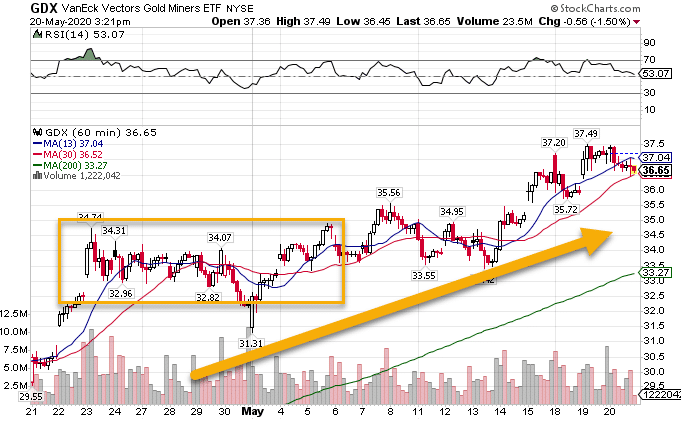
GDX Hourly Chart
You see, what’s kind of cool is that the GDX is almost like a leveraged gold play. The two tend to trade in tandem since higher gold prices mean more money for the miners.
To give you an idea, year-to-date, miners are up over 17% while gold is up just over 14%. But, if you compare that to the bottom in March, gold is up about 21%, while miners are up 126%.
However, miners can get slammed when stocks fall apart. So, I prefer to grab them when I feel that equities are at least making a bottom or heading higher.
Make moving averages your friend
Last on our list is Stitch Fix and the moving averages. This is a pretty simple concept.
When a stock is holding above the moving averages consistently, I’ll trade with the trend.
Stitch Fix is a great example of how this works on the hourly chart.
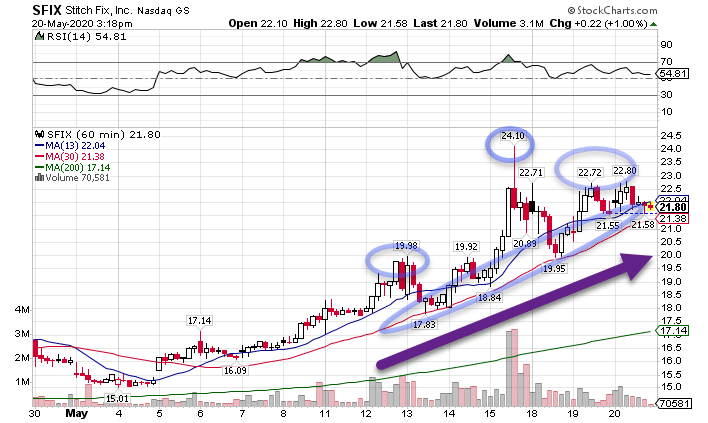
SFIX Hourly Chart
Every time price dropped down to the 30-period moving average, it popped back up. In fact, the stock would often run much higher to create peaks that I circled in the chart.
When I’ve got a stock that has a strong trend and a tendency to pop, that’s a winning combination that’s hard for me to ignore.
So now that you’ve got my best trade ideas, are you ready to learn how to use them?
Then catch my upcoming Masterclass in options trading. You’ll learn the same techniques I use to trade options every day that help me read the markets.
