Typically, I’m not one to get ahead of myself. But I can’t in good conscience not say something.
As I poured through stock charts with coffee in hand… it started to jump off the page.
After double-checking my work, I knew I was onto something…
For weeks I’ve been playing this oversold bounce for all it’s worth.
Heck, with my Bullseye Trade of the Week, I had enough conviction in a quick rebound that I made some stellar calls before Monday’s open…
And on some of the worst names out there!
Now, I’m calling a top in the market!
Why would I dare to be so bold…putting my reputation on the line?
Because I’m confident in my analysis.
This doesn’t mean stocks crash from here – just that we gnawed off the meat on this market leg.
Everything boils down to three reasons: Volatility and options, crude oil, and Fibonacci retracements.
So, stick around, you’re not going to want to miss this one – plus I’ll tell you exactly how I’m planning to trade this week.
Volatility & Options
Options trading happens to be my bacon and eggs (bread and butter just isn’t that filling). When I buy call and put contracts, there’s always a risk of implied volatility contraction.
For those of you who aren’t familiar with implied volatility, it’s a component used to price options. As traders bid up option contracts, implied volatility increases. Higher implied volatility tells me that traders expect more movement in the stock.
Since the market face planted back in March, the S&P 500 volatility index (the VIX), has contracted about 50%. However, short-term volatility expectations have not.
Let me explain a bit further. Option contracts expire for stocks in monthly cycles. While there are weekly contracts, the monthly ones define the broad volatility expectations.
Now, you can compare volatility expectations (AKA implied volatility) for the current month and future months. Usually, longer-dated options have higher implied volatility. That makes sense because the longer you hold open an option contract, the more time it has to do some crazy moves.
However, traders hold the opposite opinion right now. They worry about near-term volatility more than long-term volatility.
This is visually what it looks like.
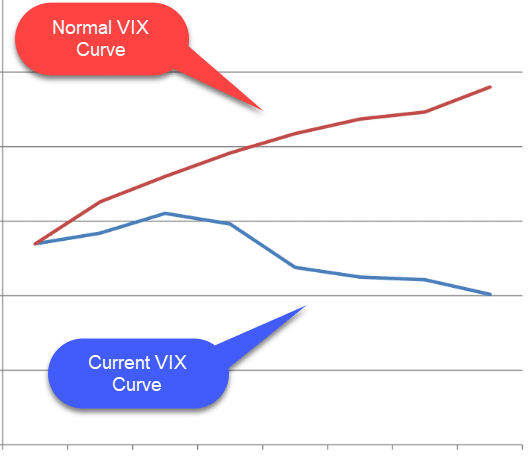
VIX Expectations Over Time
Now, this Friday is options expiration week. That happens the third Friday of every month, and generally brings in a lot of chop.
With so much fear from the crash, I expect markets to trade higher. That causes all the protection options traders bought to expire worthlessly.
Could they have bought options going into May? Yes, but it’s much less likely. People often panic late but still don’t like to spend tons of money. Most of the protective options were bought for the March and April expirations.
So, once they clear the deck and options desks collect their profits, markets will be free to move lower.
Cruddy Crude
Ohh how marvelous! OPEC members agreed to a historic production cut this weekend. Huzzah!
Nothing like a little buy the rumor sell the news.
Oil already rallied quite a bit off the lows since Saudi Arabia and Russia entered a price war.
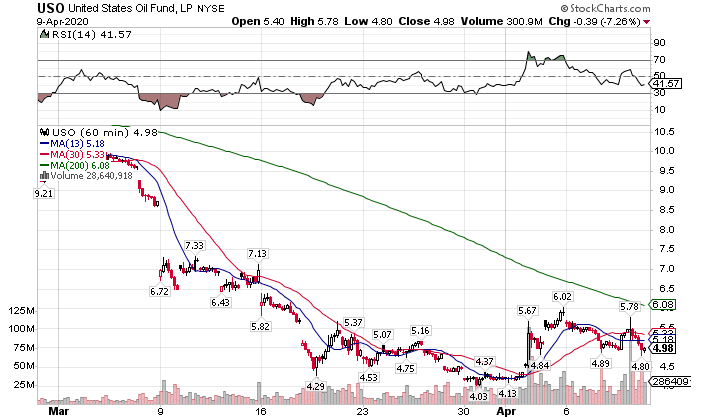
USO Hourly Chart
I know it doesn’t look like much, but trust me, that’s a big move off the bottom.
Yet, this deal is too little too late. There’s already discussions about running out of space to store crude oil. Heck, I’ve even heard of people calling for negative crude prices!
The fact is that no one is driving squat down the road at the moment. With everyone stuck in their homes and no end date in sight for the lockdowns or return to normal, we’re still supply heavy.
Instead, this will serve more as another capitulation point in an already overbought rally. Media members will treat this as signs the worst is over and parade a bunch of self-absorbed analysts on television, when in reality that’s the signal a top is in.
History Can And Does Repeat Itself
October 2007 marked the top in the market preceding the Great Recession. The SPY slipped from $157.52 to $126 by March, a little more than 20%. Over the next 45 days, the market retraced almost 61.8% of that move.
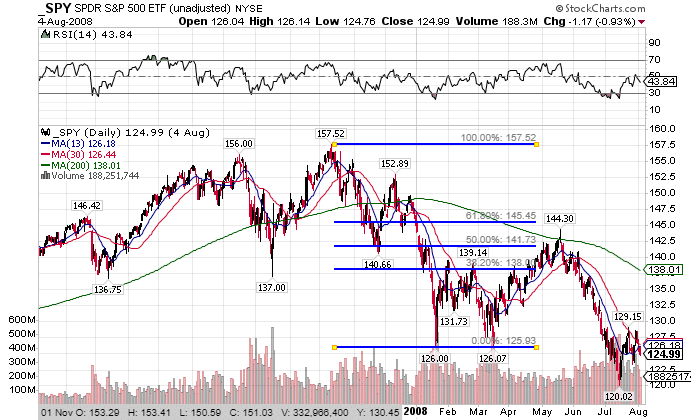
SPY Daily Chart
I’m certainly not the only one who noticed this. It’s typical market reactions that lull traders back into the market with a false sense of security, allowing current longs to sell to these suckers.
Education Moment – Fibonacci retracements use ratios from the Fibonacci sequence. This includes 38.2% and 61.8%. 50% isn’t a Fibonacci number, but most traders use it anyhow.
We’ve already made it back up to the 50% and could easily push up to the 61.8% retracement by the end of the week.
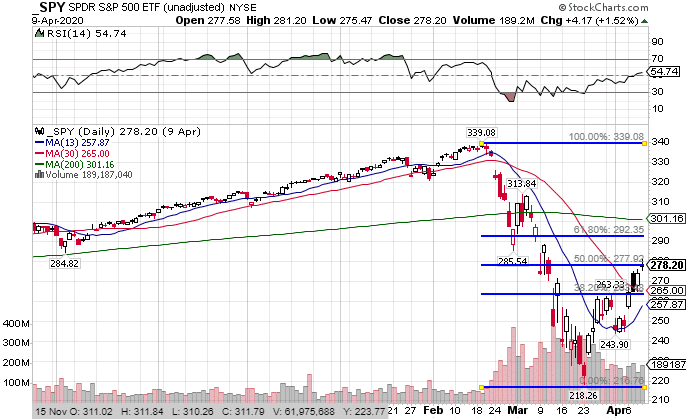
SPY Daily Chart
We already hit a high of $281.2. It wouldn’t be a stretch to come close to the $292 level. That would be a pretty remarkable achievement.
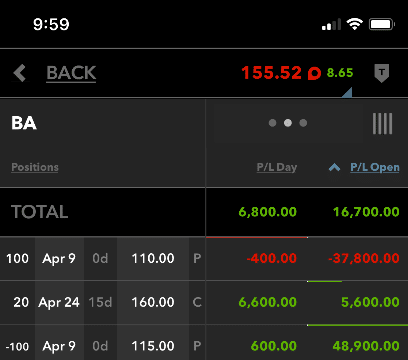
But for me, that would be a great place to start adding some call credit spreads.
This Is How I Plan To Play This Week
While Total Alpha members get access to my live trading stream, and Bullseye members get my top trading pick, I’m going to give you my basic trading plan.
Market sentiment has shifted to the bulls, but not completely.
I expect markets to rally off the following: the crude oil news, the need for options desks to turn options contracts they sold into worthless paper, and a final squeeze to push out short-sellers.
That means I’ll be keeping my trades close to the vest, not going out too far in my option contract expirations.
It can be a bit tricky if you’ve never played around with this before.
Not to worry. I’ve got a free Masterclass coming up that will go over this exact topic you don’t want to miss.
