Every chart pattern requires one key element for it to work – context.
Without context, you’re driving a car at top speed unable to see the edge of the road.
And we all know how that ends up…
Pundits didn’t think Tesla could squeeze the shorts any harder in 2020. The stock snap their necks off as it shot past $780 in the past 24 hours.
I’m not saying that I captured the entire move up. But as recently as a few weeks ago I spiked a huge win on some options.
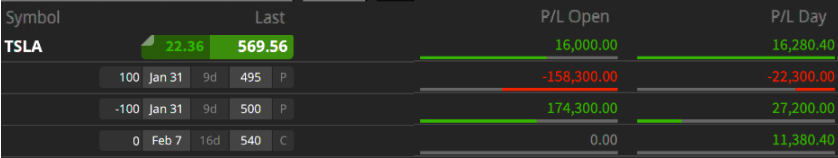 Who thought TSLA would keep climbing? I did!
Today I want to talk to you about chart patterns. Specifically, the triangle pattern. And what better stock to choose for this example—the hottest large cap stock in the game—Tesla (TSLA).
Grasping The Chart Pattern
Let me start by explaining what chart patterns are and what they are not. Chart patterns look at formations on a stock chart (normally a candlestick chart) that create shapes or outlines that identify underlying market behavior.
Chart patterns fall into two main categories: continuation and reversal. Continuation patterns identify areas of entry prior to a stock resuming its move higher or lower. Reversal patterns highlight price action that indicates a change in trend has occurred.
Understanding Context
Regardless of the chart pattern, context tells you whether it’s a viable setup or not. Look at it this way…a continuation pattern continues a trend. So, how would that work in a trendless stock? A reversal pattern changes the course of a trend. Does a bullish reversal make much sense at the all-time highs?
That’s why context is important. It’s the framework around the Tesla trade.
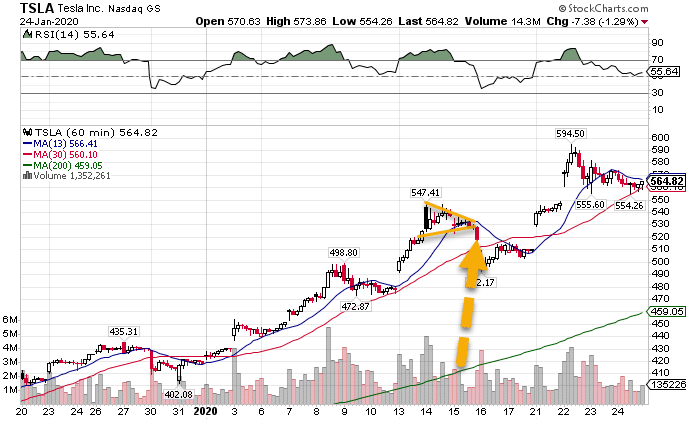
Take a look at the hourly chart in the early part of January.
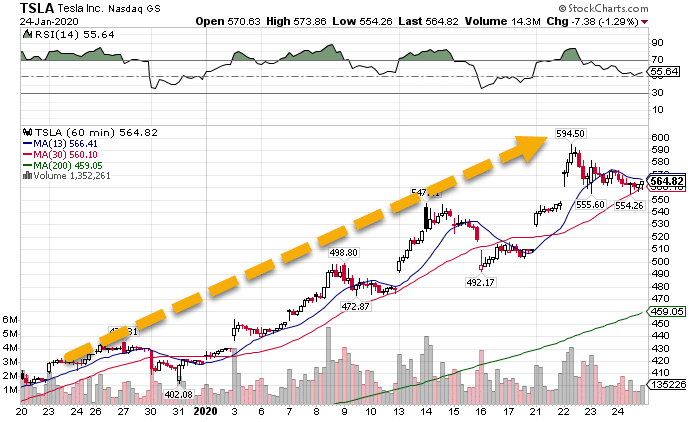
TSLA Hourly Chart
The stock clearly moves higher as time goes on. So, I wanted to find setups that let me ride this trend. If I saw a bearish reversal pattern, you can bet I wouldn’t have come near this stock.
The Triangle and Tesla
Let’s get into the good stuff. Going back to the hourly chart, I want you to look at it and see if you can find two areas that looks like this pattern.
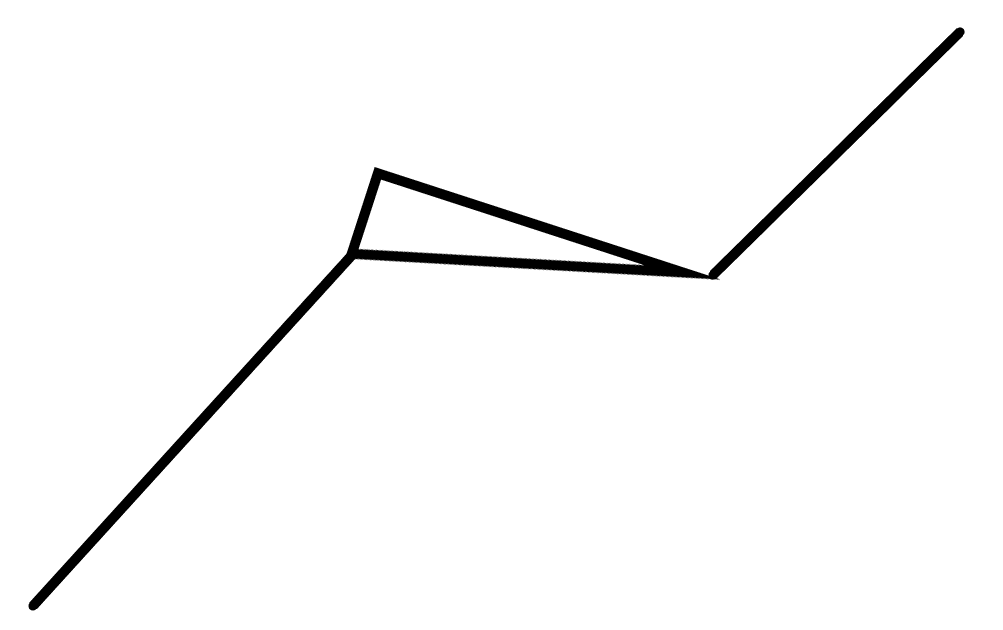
This is what they look like on the chart.
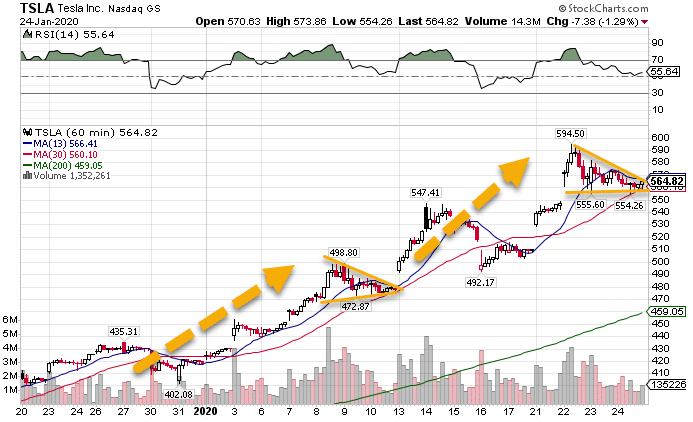
TSLA Hourly Chart
Now that we see them, let’s discuss what’s required to make these effective.
First, they MUST continue a trend. This could be an uptrend or downtrend…it doesn’t matter. If you find these patterns in a listless chart that has no direction, they are worthless.
Second, the trading range contracts as time goes on. You see this in the pattern as the lines that form the triangle come together to a point. When you see price action actually getting wider, it means something else entirely.
Third, the pattern remains intact. You might wonder why I didn’t draw a triangle where the second arrow sits on the chart. Firstly, if I tried to do it it would be sloppy. Secondly, if I did it, the price slipped below the lower trendline which broke the pattern.
TSLA Hourly Chart
All of these three main elements need to exist for the trade to work. When you only have two out of the three, it’s like kicking one of the legs out from a camera tripod.
Trading The Pattern
Once I identify a workable pattern, the trade is pretty straightforward. I want to be long (in this case) to ride the trend as it continues along it’s journey. If the pattern breaks, then I stop out of the trade.
Pro Tip: Use candle closes of whatever time-frame you’re working with to exit a trade. Sometimes intraday action can whip you out of a trade unnecessarily.
This pattern works on any chart and any time-frame. The more factors you line up in your favor, the more likely it is to work out for you.
Other Patterns To Work With
Triangle patterns are just one of the many available. The more tools you add, the more trades you find.
And that’s just the beginning. I teach Total Alpha members all the secrets I learned over the years that made me a multi-millionaire trader. There’s something for every type of trader and style.
Come find out what it’s all about.
