Did Friday’s market action give you the jitters…cause you to run and hide under your bed covers?

Buckle up, because if last night’s futures are any indication on how we might trade today, the market is headed for a further sell-off.
With earnings coming up and geopolitical risks abound—there is plenty to digest.
Each market fills in another piece to the map, helping us navigate the potential storm… And believe, me a storm is coming.
All you have to do is stitch together the patterns into a quilt of understanding.
And they say to me… we’re still heading higher, but with a bit more pullback first.
May the VIX be with you
We start this week with my favorite market-leading indicator – the VIX.
They call the VIX the fear indicator for good reason. It measures demand on options activity for the S&P 500. The majority occurs via put buying (bets the market will fall).
That’s why a higher VIX historically means participants expect the market to fall.
Friday’s price action looked like more than a haircut. We got some new features from the VIX. Look at the way the daily chart played out.
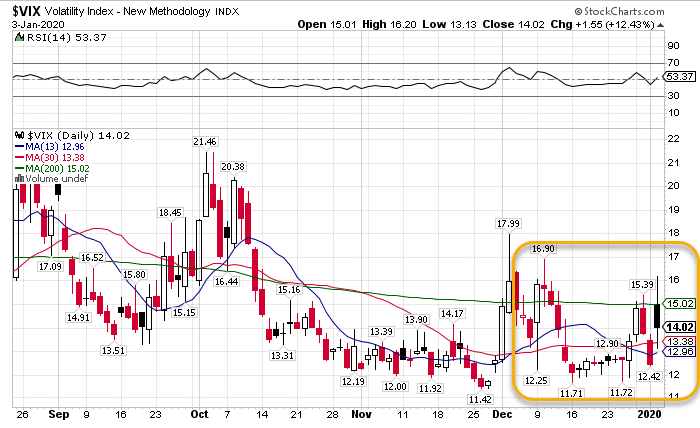
VIX daily chart
The 200-period simple moving average acted as resistance to the VIX. Price opened below it, tried to rally, and failed. It then tried to break down through the 30-period moving average as well as the open of the previous day’s candle but found support.
This tells me two things. First, the VIX isn’t ready to collapse. Second, no one wants to bet on the downside without more information.
Markets haven’t priced in the possibility of war. With multiple expansion at historically high levels, participants don’t believe the Trump administration wants a full-scale conflict.
The VVIX, which measures the demand VIX options, paints the same picture.
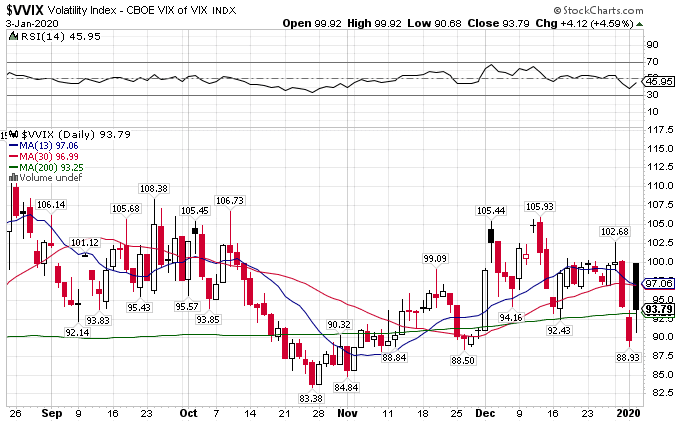
VVIX daily chart
You see the power of the 200-period moving average here again. The VVIX opened on the highs and faded to the close. However, it rallied to finish above the moving average.
This is a large reason why I believe that we’ll see more downside before we get another rally into February.
The major indices point to more downside
Markets closed Friday near session lows, right at the 13-period simple moving average.
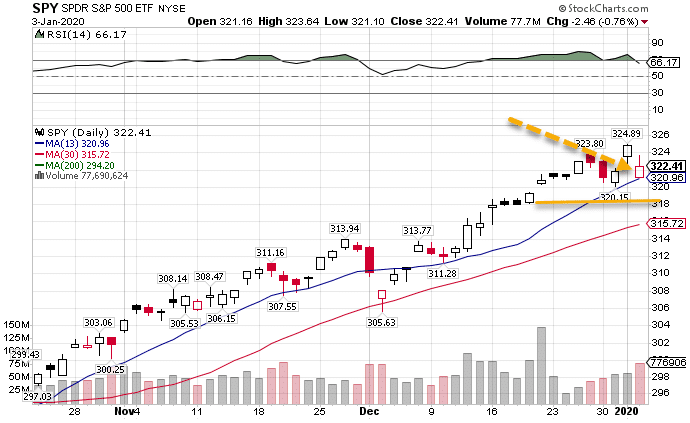
SPY daily chart
That makes me believe they want to run to test the lows for the recent consolidation down at $320, and potentially get to the last breakout area at $318.
The QQQ writes the same story. Closing at the lows of the day, this market looks like it wants to get to the 13-period moving average, which also coincides with gap fill.
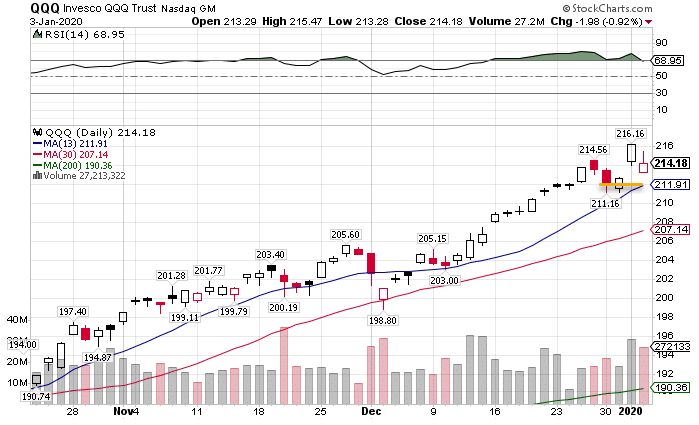
QQQ daily chart
However, the IWM already blew through its 13-period moving average, on its way to the 30-period moving average.
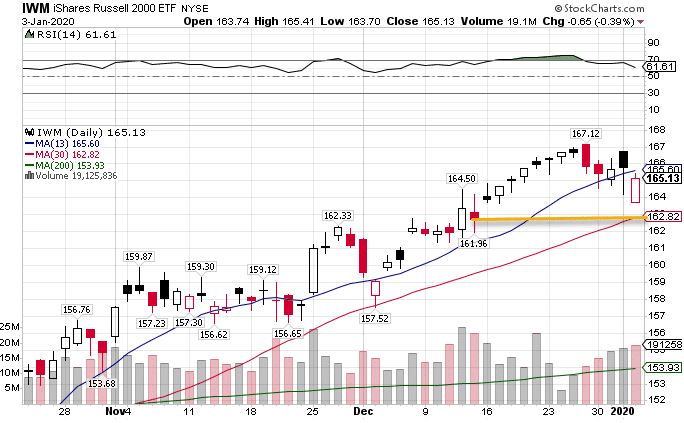
IWM daily chart
I expect this market to bottom first given how much further along it is. So, I’ll be looking to the IWM for signs of the rally turning around.
Gold’s getting ready for a multi-month run
Gold’s pullback in Q4 simply reset the bulls for their rampage. With price touching their recent highs, the yellow metal will break out in short-order.
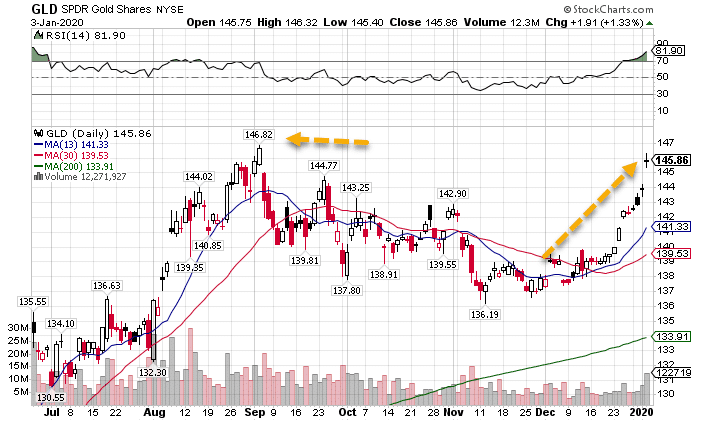
GLD daily chart
Although we’ve seen a stellar run, gold may want to gather itself before punching to the next level. Once it closes solidly above last year’s high, it will make its way to the all-time highs from earlier in the decade, an almost 30% run.
Will the bond trendline hold?
Bonds rallied off the back of the failing market Friday, putting it within earshot of the trendline that’s held it back since the fall.
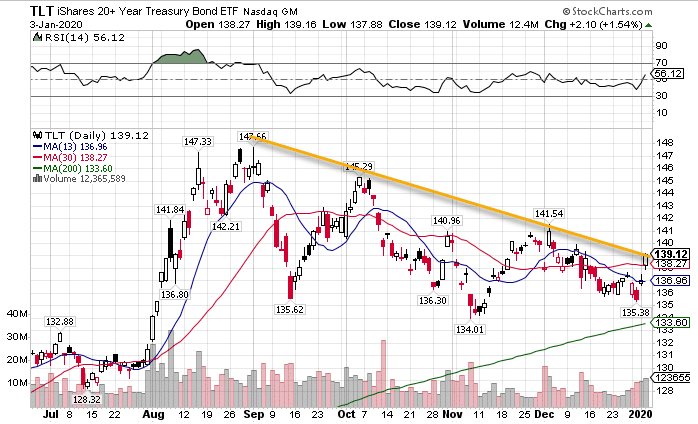
TLT daily chart
Bonds are a tricky spot right now. I don’t think they collapse, nor do I see them taking out the all-time highs. That’s why I’m taking a market-neutral approach in my Total Alpha portfolio with an Iron Condor strategy. It’s an options strategy that I use to profit off time and implied volatility decay that I’m currently teaching to Total Alpha Members.
Crude is poised for some big gains
One thing we do know about the political unrest in the Middle East – it drives up the price of crude oil. Oil & Gas exploration companies (XOP) and the black gold itself saw price rapidly appreciate the last several weeks.
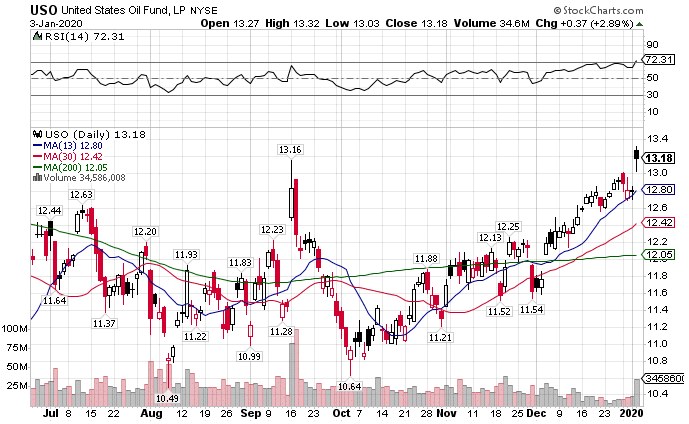
USO daily chart
Price actually managed to break above the previous swing high from September off the news of an attack that wrecked Saudi production.
Today, oil worked its way higher, building a solid base with lots of support. With tightening credit from U.S. lenders to fracking companies, production may begin to tail off. If global demand is returning, that brings up the demand side of the equation.
All this leads to a positive outlook for the big slick.
My Total Alpha Quarterly Picks
I delivered my Total Alpha members my quarterly picks last week. These are the best places that I expect to far outperform the broader market. Normally, I only deliver one. However, I gave members two: a 401k and speculative choice.
The 401k choice could return 50% over the next quarter, while the speculative choice could easily exceed 500%.
There’s still time for you to get in on these monster trades. You could be growing your account while the market thrashes everyone else.
Click here to Join Total Alpha
